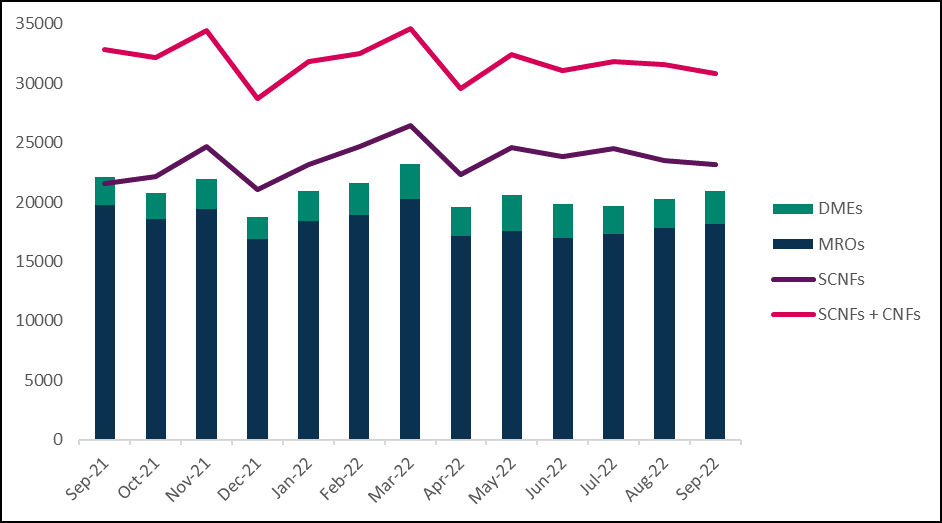
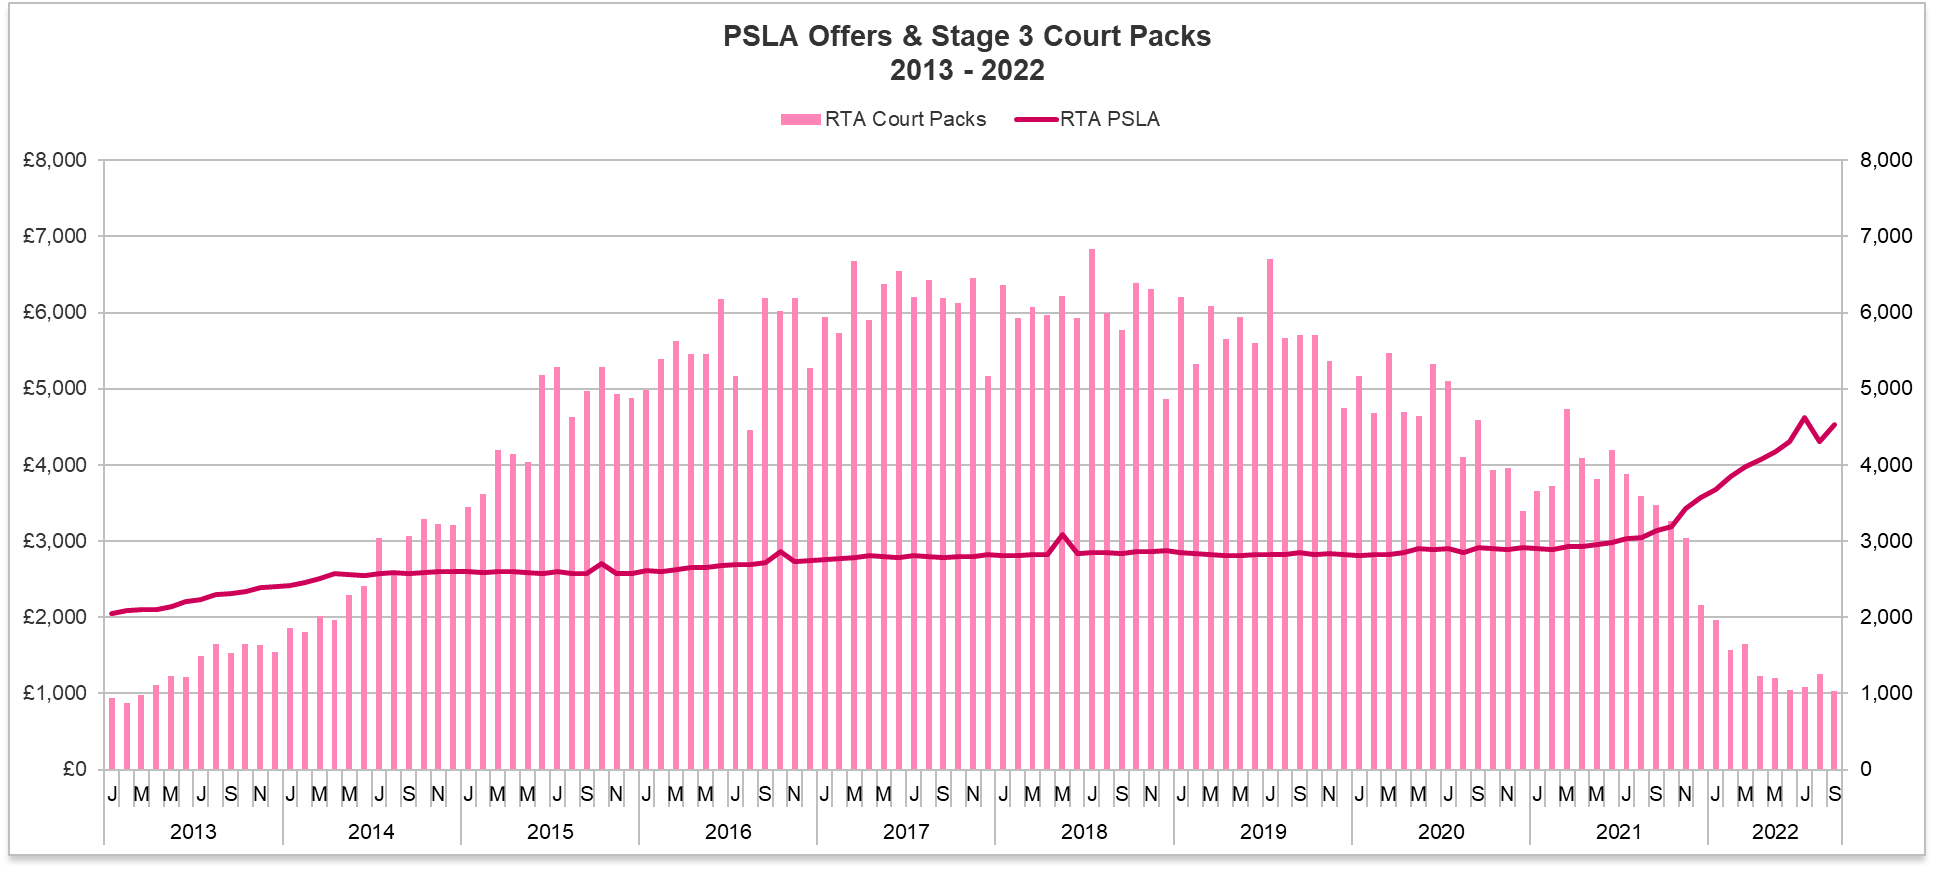
We start by looking at claims volumes and the OIC data has been fairly consistent over the last year with a total of 283,965 claims received in the 12 months of October 2021 to September 2022 inclusive. An average of 23,664 claims per month. Volumes appear to have stabilised between May and September 2022.
If we take into account the MOJ portal data for the same period, then the average number of claims received each month for the same period is 8,151 per month and 97,817 in total. This leaves us with a combined total of 381,782 claims received in the last 12 months, an average of 31,815 a month as shown in the graph below:
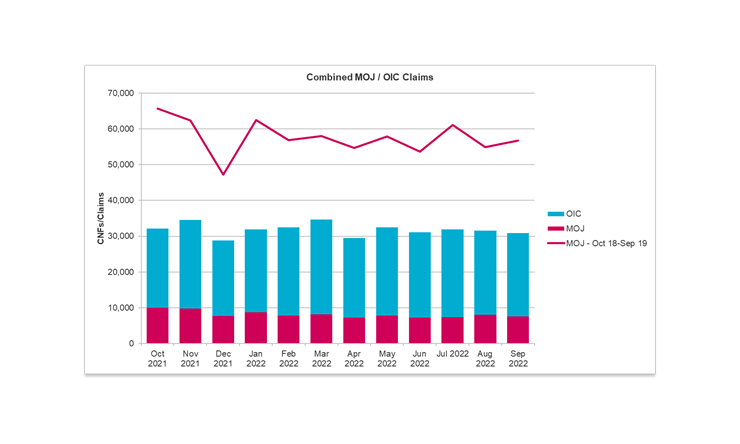
How does this compare to the same period before the pandemic? Well, for the period October 2018 to September 2019 a total of 691,320 claims were received which is an average of 57,610 per month as represented by the red line above. That means there has been a significant reduction of 44.8%. Whilst a small percentage decline would be expected because of personal injury inflation which would impact claims at the top end of the MOJ £25k bracket, a change of 44.8% represents a significant drop in claims volumes.
One of the factors cited for the drop in claims is that claimant representatives have lowered their marketing budget and are no longer advertising for low value RTA claims. This interesting point brings into question the true number of injured claimants in the absence of proactive marketing by solicitors and claims farming models from CMCs.
If we go back to 2000-2005, the RTA costs regime was very attractive for claimant solicitors. ATE and success fees were recoverable from the third party, and the majority of RTA claims were still assessed on a standard hourly rate costs basis, with limited and then relatively generous fixed recoverable costs introduced in 2003. An injured claimant would have no issue finding a solicitor willing to deal with their injury claim and solicitors had been allowed to advertise in the press and on radio for some time previously.
The average number of claims for 2000 to 2005 was 395,735. In 2011 to 2012 claims volumes peaked at 828,489, more than double the average for 2000 to 2005.
The graph below evidences the rise and fall of motor injury claims reported to the CRU from 2000 to date:
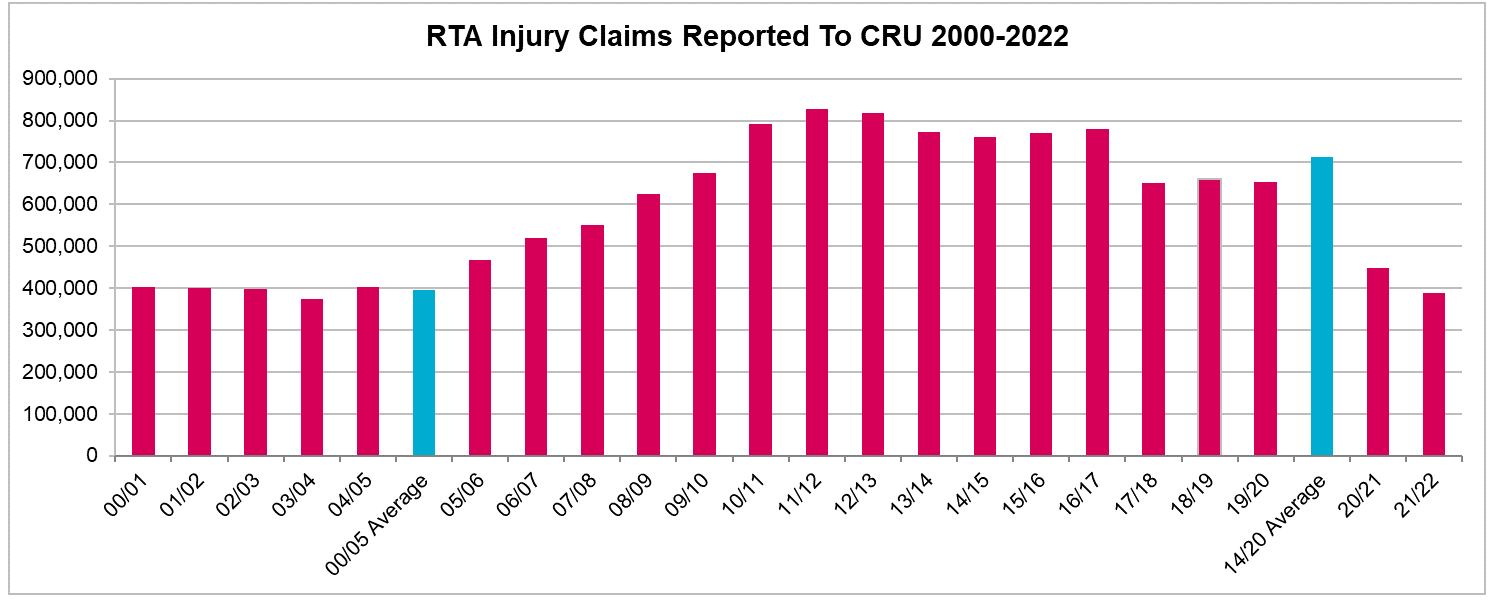
As we can see, claims frequency was stable from 2000 to 2005 but in 2004 referral fees were legalised and this had a significant impact on claims frequency. CMCs such as Claims Direct entered the market and new business models were formed. Claimants were proactively contacted to make claims and insurers started new revenue-generating business models, changing their supply chain. Total PI/TPD claims frequency increased from 20% in 2004 to 39% in 2012 according to data from the Institute and Faculty of Actuaries.
A combination of the 2013 LASPO reforms which reinstated the referral fee ban, the extension of the OIC portal and a reduction in fixed fees had reduced CRU reported claims numbers to 653,052 before the pandemic.
So we can see that for the last reported period April 1st 2021 to March 31st 2022 CRU claim volumes stood at 387,687 which is remarkably close to the 2000 -2005 pre-referral fee average of 395,735.
Whilst we can't ignore the impact of Covid of course, it could be argued that the cumulative effect of whiplash reforms has been to finally drive claims volumes down to their "natural" level without the distorting impact of claims farming and referral fees. As in a number of other walks of life. Covid has had an accelerating effect but is no longer the determinative factor as we know from current traffic levels.
We don’t have the accident data yet to accurately compare accident frequency from 2000- 2005 to current levels but actuaries will be able to compare PI/TPD ratio which is the key metric to enable direct comparison. It should also be remembered that we have seen nearly 20 years development in vehicle safety over this period, so you might expect the PI/TPD ratio to have fallen.


