


CRU Data
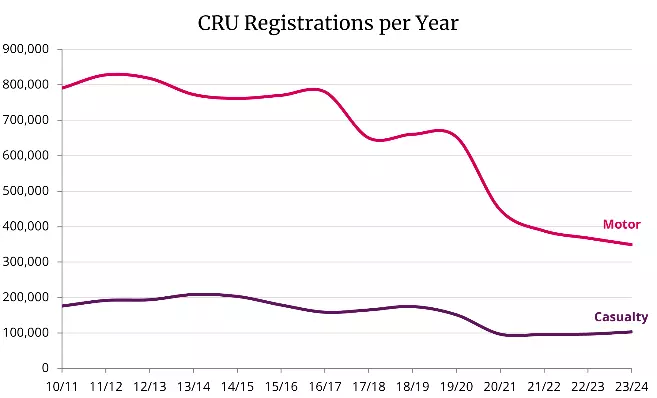
After 4 years of steeply declining volumes we have this year seen an uptick in casualty claims reported to the CRU. The 23-24 figure shows a modest increase of 1.87% in employers liability claims and a more significant increase of 10.35% in public liability claims from 22-23 (CRU data runs from April 1st to 31st March).
As the table below shows there has been approximately a 40.84% fall in combined employer and public claims from 2018/2019 (data set unaffected by the pandemic) to 2023/2024.
Claims registered with the CRU:
|
Year |
Clinical negligence |
Employer |
Motor |
Other |
Public |
Liability not known |
Total |
| 2023 to 2024 | 15,839 | 44,547 | 348,806 | 8,299 | 58,933 | 796 | 477,220 |
| 2022 to 2023 | 14,443 | 43,728 | 367,535 | 4,743 | 53,403 | 478 | 484,330 |
| 2021 to 2022 | 15,549 | 43,769 | 387,687 | 4,598 | 52,724 | 679 | 505,006 |
| 2020 to 2021 | 14,485 | 45,687 | 446,976 | 4,577 | 51,286 | 1,348 | 564,359 |
| 2019 to 2020 | 15,845 | 79,027 | 653,052 | 7,086 | 72,587 | 1,655 | 829,252 |
| 2018 to 2019 | 16,809 | 89,461 | 660,608 | 7,614 | 85,472 | 2,392 | 862,356 |
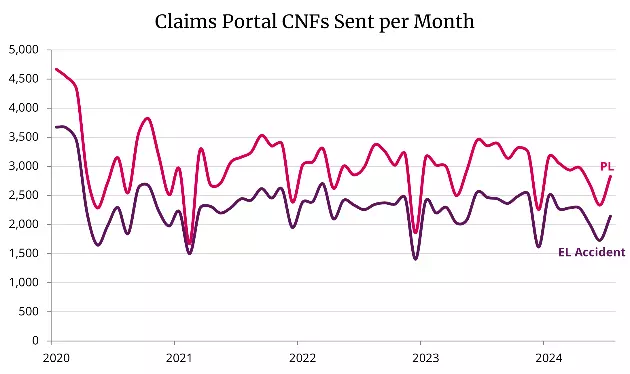
MOJ Portal Data
Claims registered in the MOJ Portal supports a fairly stable picture with a similar shape to EL and PL claims submissions over this period and no significant upwrd trend.
Claim frequency trends
The big question for casualty insurers is what is behind the significant drop in frequency since the pandemic and is this likely to be a permanent trend? As the table shows there has been approximately a 40.84% fall in combined employer and public claims from 2018/2019 (the last data set unaffected by Covid) to 2023/2024.
The fact that both EL and PL registrations have declined at a similar rate suggests that the cause of the decline does not discriminate between EL and PL claims.
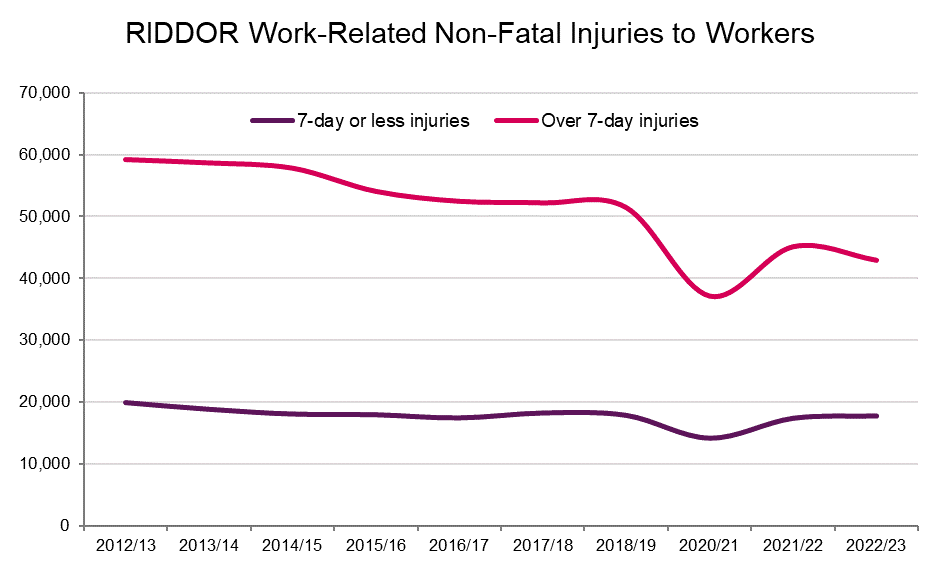
Health and Safety data (latest update Nov 2023) provides another lens through which to view casualty frequency. Have recorded accidents at work returned to pre-pandemic levels?
Work-related accident frequency trends
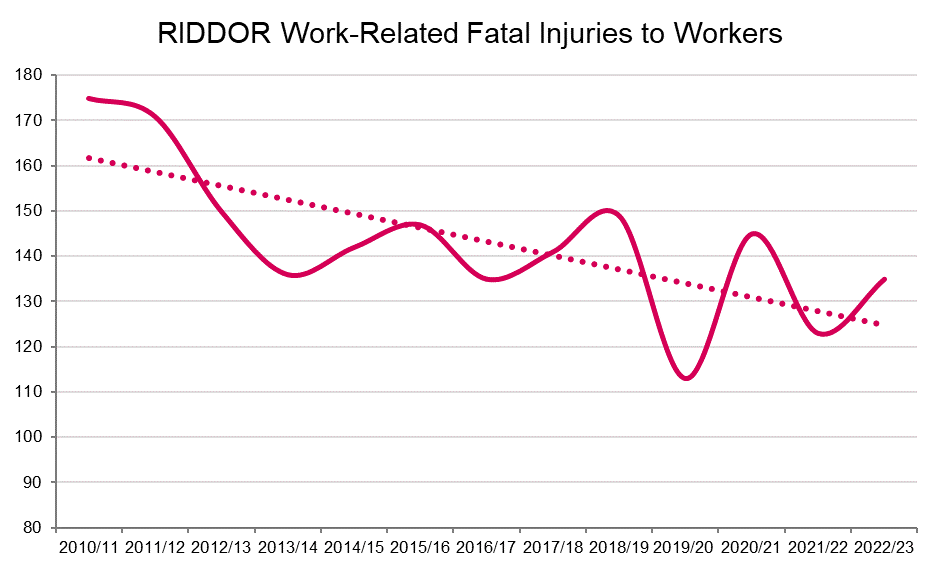
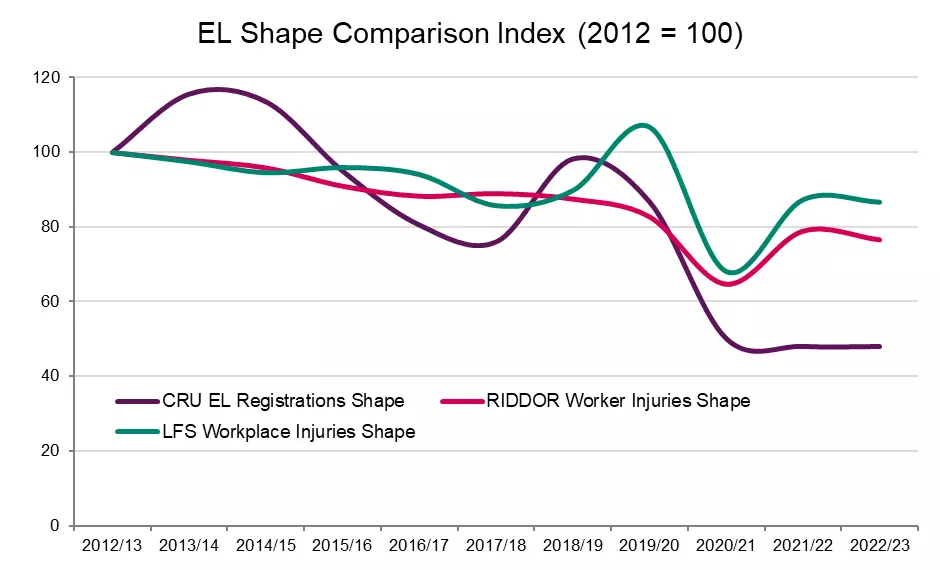
Riddor Data shows a general downward trend in non-fatal injuries requiring over seven consecutive days absence with incidents continuing to fall by 16.7% since 2018/19. This is perhaps indicative of improvements in health and safety over this period which has also seen a significant decline in work related fatalities. Significantly less serious seven day or less injuries have largely returned to pre-pandemic levels and are down less than 1% since 2018/19.
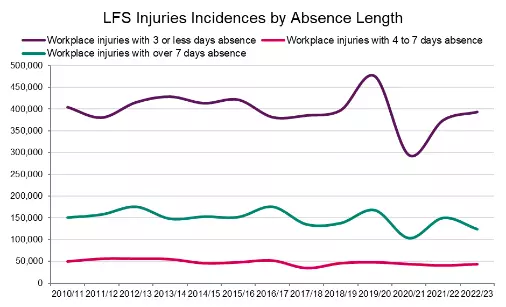
The annual Labour Force Survey (latest update November 2023) shows a similar pattern with more serious injuries declining over time but less serious injuries returning to pre-pandemic levels.
If we compare the trends in EL claims to EL accidents we can see that the fall in volumes appears to be related to factors other than accident frequency as there has been no significant recovery in claims volumes compared to accident frequency.
Falling RTA claim volumes
What then is the factor affecting claim patterns in casualty claims? One hypothesis is that the fall is a by-product of the decline in claims marketing activity.
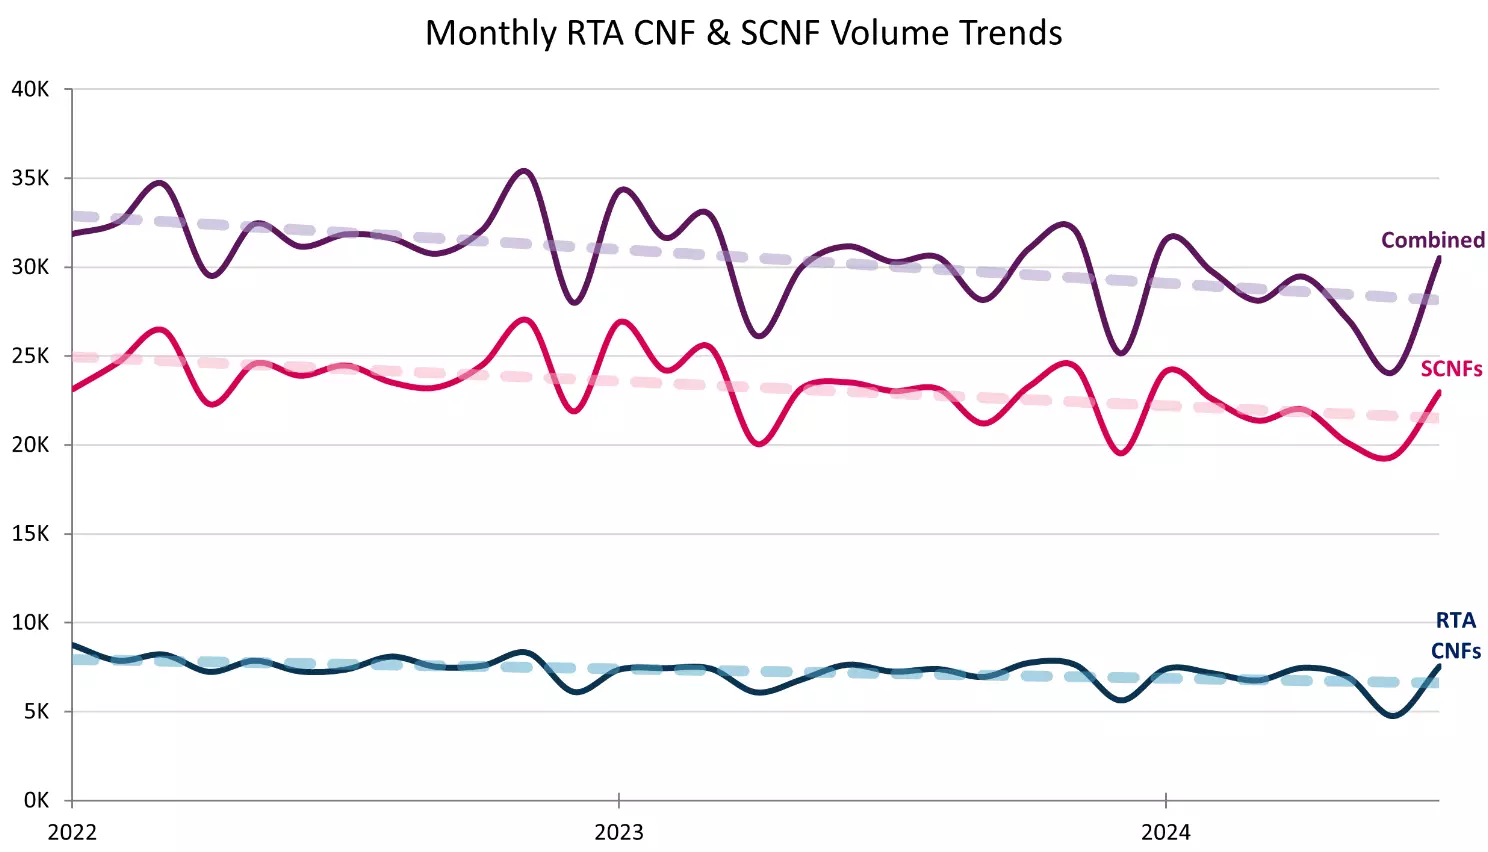
The graph below shows the fall in motor claims since the pandemic and the continued fall since May 2021 when legislation was introduced to reduce the value of whiplash injuries and remove entitlement to legal costs for a high percentage of injuries valued at less than 5k. The IFOA Third Party Working Report concluded that overall accident frequency for 2022 had recovered to 90% of 2019 levels. The graph below shows claim frequency has continued to fall in this period.
You can see the trends in motor claims clearer in the graph below. This shows a continued decline in both OIC and MOJ Portal volumes since 2022.
Claims marketing activity
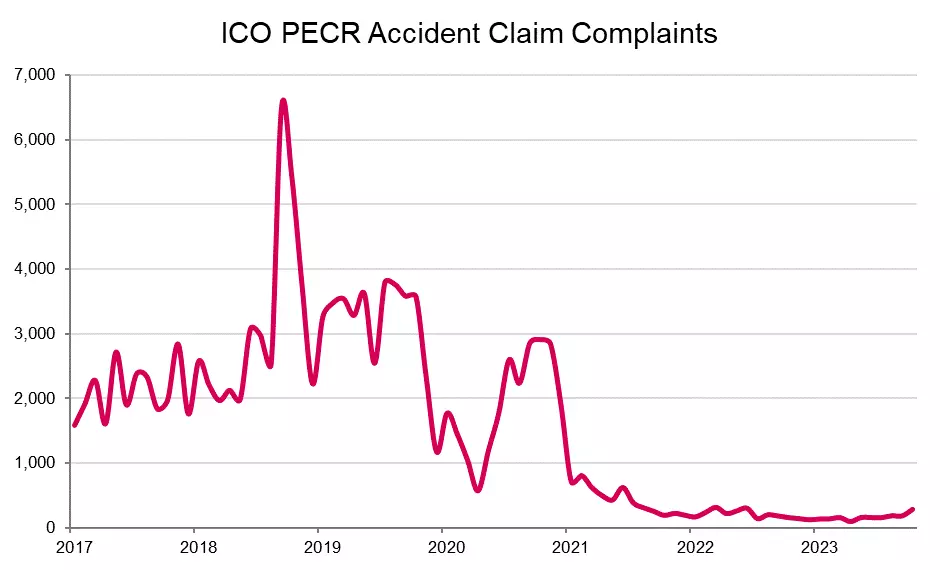
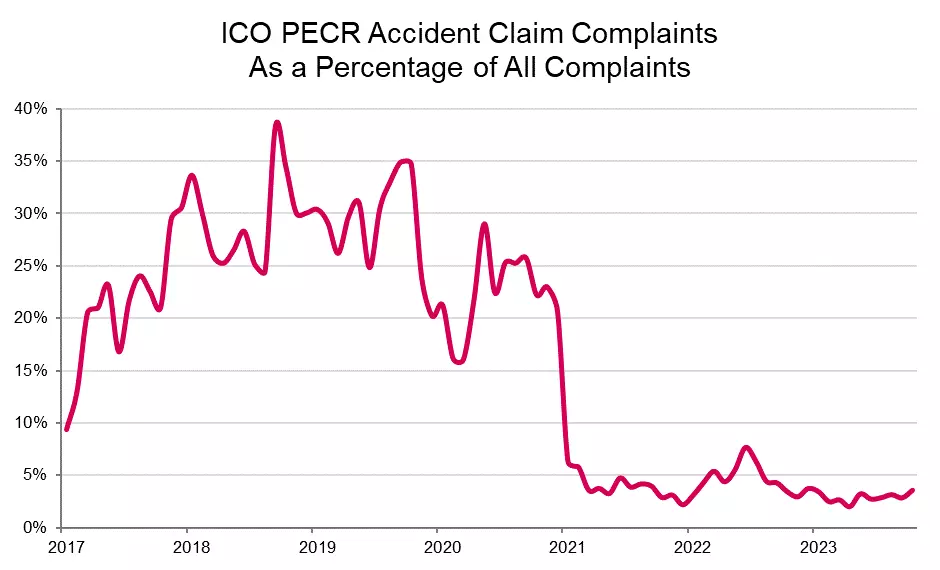
The whiplash reforms in May 2021made motor claims less attractive and reduced marketing activity. The graph below shows the number of complaints made to the ICO for breaches of the The Privacy and Electronic Communications Regulations (PECR) which apply to the sending of direct marketing messages by telephone calls, text messages and emails. This highlights a sharp reduction in accident claim related nuisance marketing complaints at the beginning of 2021 when the OIC was introduced. Notably, this does not appear to be a result of the pandemic, as levels spiked in the later months of 2020. The 2021 drop is even clearer when you view the percentage of accident claims against all complaints.
Conclusion
We know that when claims farmers target RTA claims in marketing they pick up some EL/PL claims as a 'happy by-product'. The cost benefit analysis to target these claims alone is prohibitive due to lower claim volumes increasing capture costs. It is likely that reduced claims farming activity in RTA BI has also led to a reduction in EL/PL claims which would previously have been caught in the trawlers net. If this hypothesis is correct, it suggests that the frequency gains in casualty could be vulnerable to CMC's and solicitors developing more efficient and bespoke El/PL claims marketing strategies.