• GL
Choose your location?
  • Global Global
  • Australian flag Australia
  • French flag France
  • German flag Germany
  • Irish flag Ireland
  • Italian flag Italy
  • Polish flag Poland
  • Qatar flag Qatar
  • Spanish flag Spain
  • UAE flag UAE
  • UK flag UK

Retail Market Monitor UK

Staying ahead of the market trends can prove crucial to maintain competitive advantage, especially in a fast-moving and price sensitive sector such as retail. Our Retail Market Monitor provides the key information you need to understand the market.

Typing on laptop
Laptop with code on screen
Smart phone

The economic and regulatory landscape is shifting dynamically in a way that we have not seen for years. We can still feel the impact of the COVID pandemic and as recession looms, the retail market has seen some significant fluctuations in sales across the board. 

Based on the Office for National Statistics (ONS), our Retail Market Monitor provides you with key indicators released every month, including the Consumer Prices Index (CPI), inflation rates, Year on Year (YoY) change, and sales by volume and value.

We scan the horizon every month to keep you abreast of the current market trends across a set of retail sub-sectors, including clothing and footwear, food and non-alcoholic drinks, alcoholic drinks and tobacco, furniture and household goods, as well as recreational goods (incl. electronics) and assess what the results could mean for your business.

Stay informed and uncover what's happening in the retail market by viewing the latest monthly results below:

Retail, Food & Hospitality Sign Up
Sign up to receive our weekly Retail, Food & Hospitality updates
   

September '23 Market Monitor

As the retail sales value slightly increased, and the sales volume stays relatively on the same level, the divergence between the two continues to deepen. However, despite the Consumer Prices Index continuing to decrease, this has not yet led to wider price decreases.
 
September '23 Market Monitor

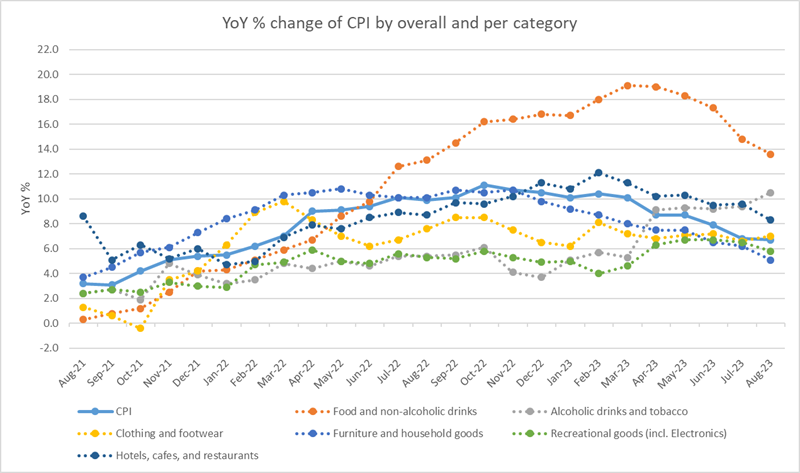
YoY % CPI change

Chart 1

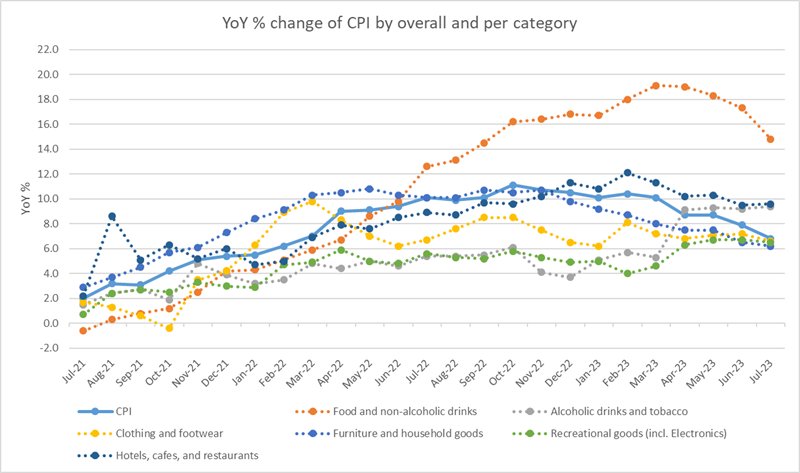
The Consumer Prices Index (CPI) increased by 6.7% in August 2023, a slight decline as compared to the previous month's 6.8%. This was a result of prices falling 0.3% on the month versus a rise of 0.5% in the previous year, as was the case in July. The easing in the annual rate was driven by downward contributions from many areas, but particularly in the restaurants and food sectors.

Food and non-alcoholic beverages annual inflation rate dropped 80 points to 13.6% in August, following a significant 250 point drop in the previous month. This is now the slowest annual rate of growth since September 2022, and far below the high of 19.1% in March 2023. 7 out of 11 categories contributed to the decrease in inflation growth, with the largest coming from the milk, cheese and eggs, vegetables and fish categories.

Furniture and household goods prices rose by 0.2% between months, compared with a 1.3% rise in the previous year, resulting in a 5.1% annual rate and denoting a 110 point drop. Additionally, household appliances saw a 240 point drop to 1.8%, contributing a significant downward effect to this category. The hotels, cafes and restaurants sector rate fell 130 points to 8.3%, as prices fell by 0.1% month-on-month.

Other major categories showed smaller movements between July and August 2023. For example, alcoholic drinks and tobacco increased by 110 points to 10.5%; clothing and footwear increased by 40 points to 7%; and recreational goods went down 70 points to 5.8%, with audiovisual products in particular providing a downward contribution.

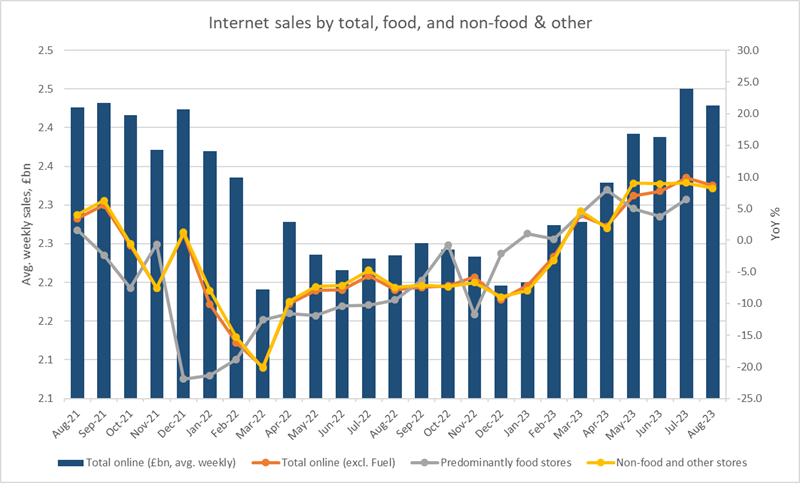
Internet sales

chart 2

Internet average weekly sales increased 8.7% to £2.43bn in August 2023, up 62.7% versus the pre-pandemic February 2020 level. As a proportion of total sales, internet retailing accounted for approximately 26.9%, slightly below the 27.4% reported in July 2022 yet still over the pre-pandemic level of 19.9%.

Food store sales increased by 6.5%, and non-food and other stores showed an 8.2% increase. Clothing and footwear saw a 17.4% jump last month and was supported by a 16.8% increase in household goods.

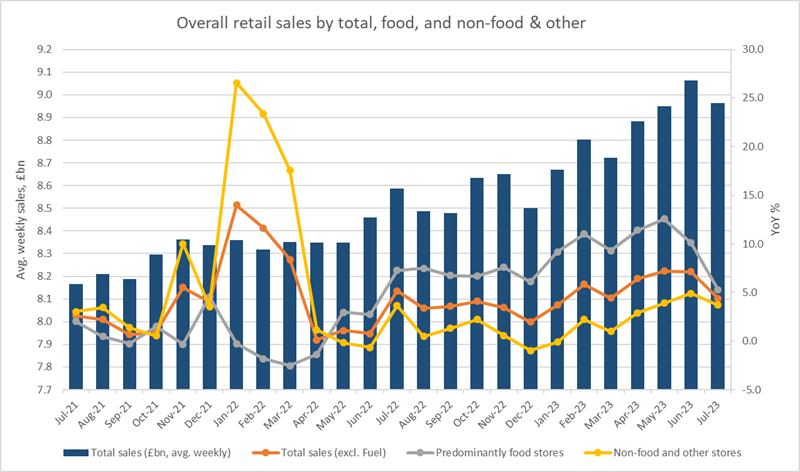
Overall retail sales

chart 3

Overall, average weekly sales increased 6.4% to £9.02bn in August 2023, reflecting a 19.0% increase versus the pre-pandemic February 2020 level. However, this is due in part to the high level of inflation currently being experienced. Food store sales were up 6.9%, whereas non-food and other stores (including online) showed a 6.0% increase. Clothing and footwear experienced a 9.8% increase and household goods went up 2.2%.

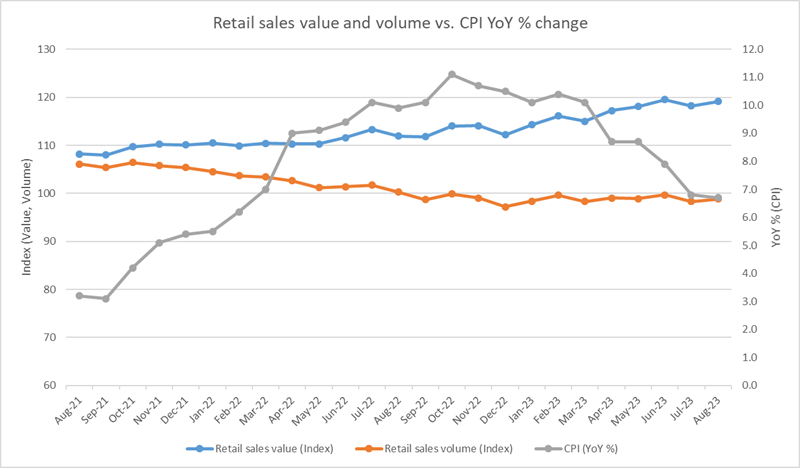
Retail sales value and volume

chart 4

As months pass, the divergence between the quantity of retail goods bought (volume) and the amount which is spent by consumers (value) still continues to deepen due to high levels of inflation, which have led to marked price increases. Whilst CPI has continued to decrease in last month, the impact of this has not yet led to wider price decreases which would support the closing of the gap.

Overall, retail volume decreased by 1.5% in August 2023 as compared to the previous year - in August 2022 this decline was 5.4%, whilst July 2023 showed a 3.3% decrease. This marks 17 consecutive periods of volume growth declines. On the other hand, the overall retail value increased 6.4% year-on-year last month, as compared to a 3.4% increase in August 2022 and a 4.3% increase in July 2023.

Analysis and commentary prepared by Dominic Watkins and Eleanor Smith based on the latest data released by the ONS.

August '23 Market Monitor

We continue to see a YoY decrease in the Consumer Prices Index, which was a result of 0.4% price fall as compared to last year. However, the high level of inflation still affects the divergence between the retail sales volume and value.
 
August '23 Market Monitor

Year on year change of CPI 

ons 1

The Consumer Prices Index (CPI) increased by 6.8% up to July 2023, marking a substantial dip of 110 points as compared with June. This was a result of prices falling 0.4% on the month versus a rise of 0.6% in the previous year. Food prices in July rose but by less than in 2022, subsequently leading to an easing in the annual inflation rates.

Food and non-alcoholic beverages annual inflation rate growth dropped by 250 points to 14.8% in the latest month, the slowest annual rate of growth since September 2022 and far below the high of 19.2% in March 2023. Whilst 10 of the 11 categories experienced fall in inflation, the largest downward contributions in July 2023 were from dairy and eggs, bread and cereals, and fruits.

Furniture and household goods dropped by 30 points to 6.2%, following a sharp drop in the previous month, as four of the five elements within the sector eased significantly.

Other major sectors showed smaller movements between June and July 2023. Hotels, cafes and restaurants increased by 10 points to 9.6%, alcoholic drinks and tobacco increased by 20 points to 9.4%, clothing and footwear decreased 60 points to 6.6%, and recreational goods were down 20 points to 6.5%.

Internet sales by total, food, non-food & other

chart 2

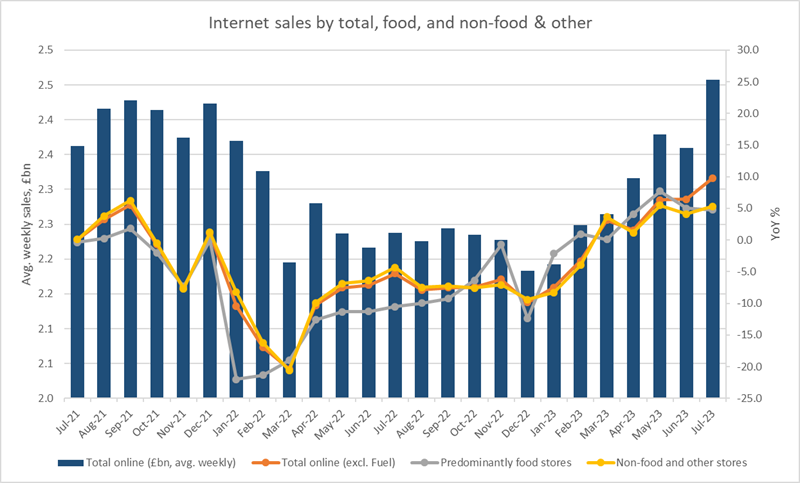
Internet average weekly sales increased 9.8% to £2.46bn in July 2023, a slightly higher year-on-year level versus the 6.5% for June, and up 63.5% versus the pre-pandemic February 2020 level. As a proportion of total sales, internet retailing accounted for approximately 27.4%, higher than the 26.1% reported in July 2022 and solidly above that of the pre-pandemic level at 19.9%.

Food store sales rose by 4.8%, whilst non-food and other stores experienced a 5.3% increase. Clothing and footwear jumped 9.9% against July 2022 and household goods increased by 3.7%. The ONS stated "Shoppers switching to online shopping because of poor weather and increased promotions led to 27.4% of retail sales taking place online in July 2023."

Overall retail sales by total, food, non-food & other

chart 3

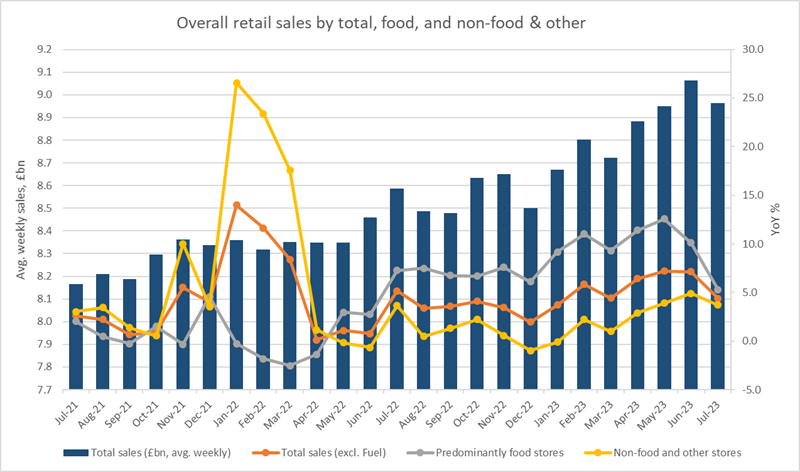
Overall, average weekly sales increased 4.4% to £8.96bn in July 2023, reflecting an 18.4% increase versus the pre-pandemic February 2020 level. However, this is due in part to the high level of inflation currently being experienced. Food store sales were up 5.3%, whereas non-food and other stores (including online) showed a 3.7% increase. Within this sector clothing and footwear saw a 4.3% increase whilst household goods decreased by 0.1%.

Retail sales value and volume vs CPI

chart 4

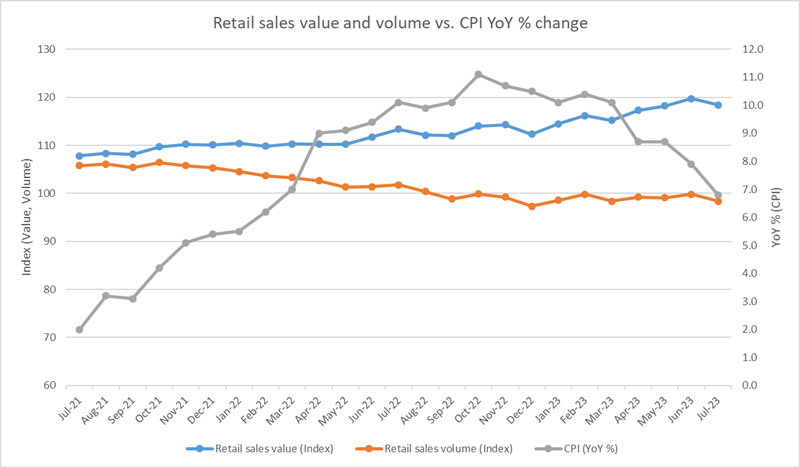
The divergence between the quantity of retail goods bought (volume) and the amount which is spent by consumers (value) has continued to deepen due to high levels of inflation which have lead to marked price increases. Whilst CPI decreased in the latest month, the impact of this has not yet lead to wider price decreases, which would support the closing of this gap.

Overall, retail volume decreased by 3.3% in July 2023 against the previous year. In July 2022 this decline was 3.8%, whilst June 2023 showed a 1.6% decrease. This marks 16 consecutive periods of volume growth declines. Retail value, on the other hand, increased 4.4% year-on-year during the latest month, as compared to a 5.2% increase in July 2022 and a 7.2% increase in June 2023.

Analysis and commentary prepared by Dominic Watkins and Eleanor Smith based on latest data released by the ONS. 

July '23 Market Monitor

The overall Consumer Prices Index has dropped 80 points and we have also seen some decrease in the annual inflation rate across number of sectors. Although this shows improvement as compared to past few months, the divergence between the quantity of retail goods bought and the amount which is spent by consumers continues to deepen. 
 
July '23 Market Monitor

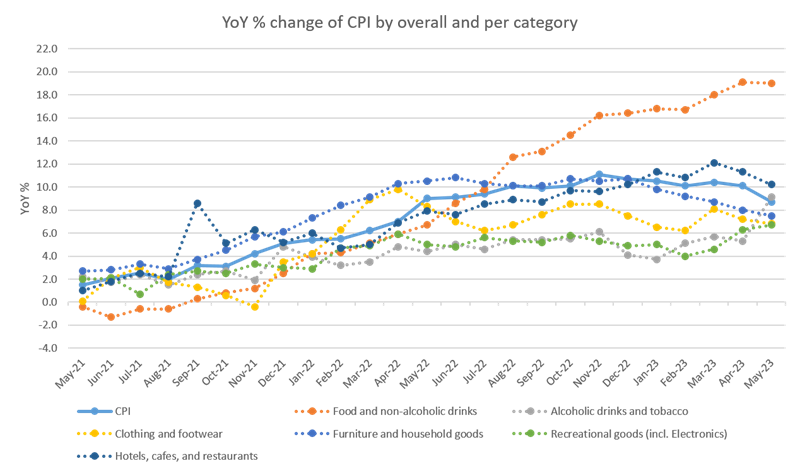
The Consumer Prices Index (CPI) increased by 7.9% during the year up to June 2023, a notable dip of 80 points compared with the previous month. However, month-by-month CPI rose by 0.1%, albeit much lower than the 0.8% monthly rise in June. The ONS commented: "Falling prices for motor fuel led to the largest downward contribution to the monthly change in CPIH and CPI annual rates, while food prices rose in June 2023 but by less than in June 2022, also leading to an easing in the rates… There were also notable downward effects from food and non-alcoholic beverages, furniture and household goods, and restaurants and hotels."

Food and non-alcoholic beverages annual inflation rate growth dropped by 100 points to 17.4% in the latest month. Whilst still the highest level in the past decade, this marks improvement from the recent 19.2% in March 2023. The largest downward contributions continued to be driven by milk, cheese, and eggs but supported by smaller effects in meat, bread and cereals.

Similarly, furniture and household goods dropped by 100 points to 6.5%, as four of the five elements within this sector eased significantly. Furniture, furnishings, and carpets dropped from 8.2% in May 2023 to 6.4%; textiles from 4.3% to 3.8%; appliances from 6.2% to 5.1%; glassware and utensils from 2.2% to 1.9%; and household and garden tools from 5.6% to 5.3%.

All other major sectors showed smaller movements between May and June 2023. For example: hotels, cafes and restaurants decreased by 80 points to 9.5%, alcoholic drinks and tobacco by 10 points to 9.2%, clothing and footwear increased by 10 points to 7.2%, and recreational goods remained flat at 6.7%.

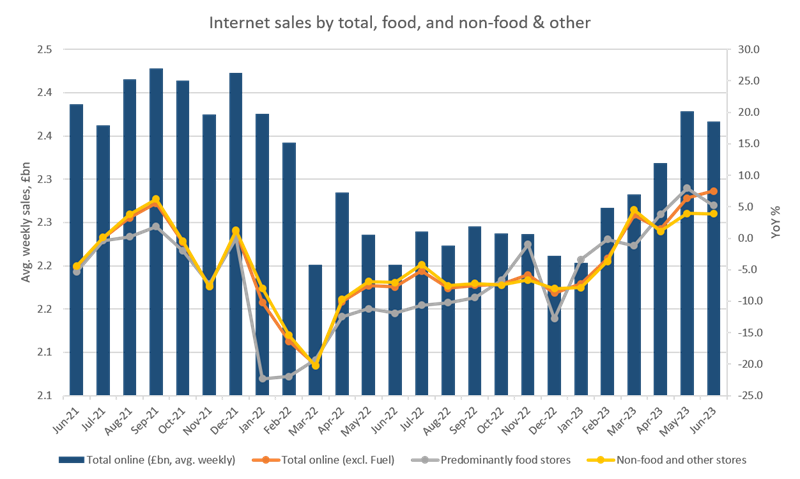
Internet average weekly sales increased 7.5% to £2.37bn in June 2023, a slightly higher year-on-year level versus the 6.4% in May, and up 57.5% versus the pre-pandemic February 2020 level. As a proportion of total sales, internet retailing accounts for approximately 26.0%, similarly as in June 2022, but remains much higher than the pre-pandemic level of 19.9%.

Food store sales rose by 5.2%, whilst non-food and other stores experienced a 3.9% increase. Clothing and footwear jumped 11.4% against June 2022 level and we saw a 6.1% increase in household goods. The ONS stated: "Online spending values fell by 0.5% in June 2023 because of monthly falls in clothing and food stores as they returned to previous levels following increases last month."
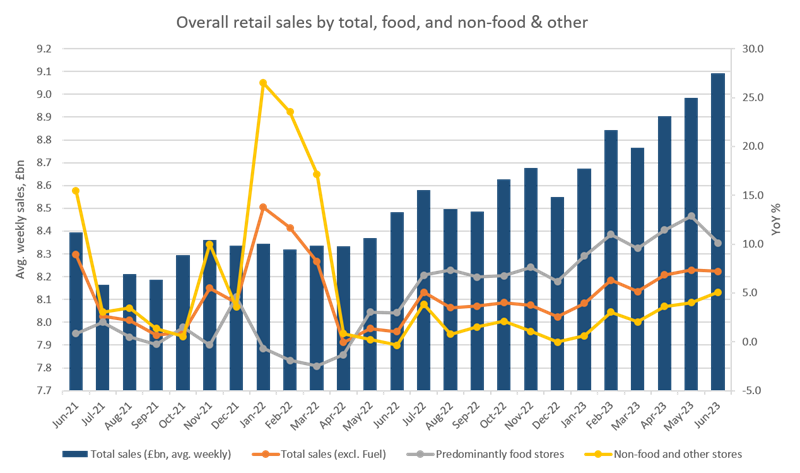
Overall, average weekly sales increased 7.2% to £9.09bn in June 2023, reflecting a 20% increase versus the pre-pandemic February 2020 level. Yet, this is due in part to the current high level of inflation. Food store sales saw a 10.1% increase, whereas non-food and other stores (including online) showed a 5.1% increase. Within this sector, clothing and footwear increased 9.1% whilst household goods went up 5.3%.
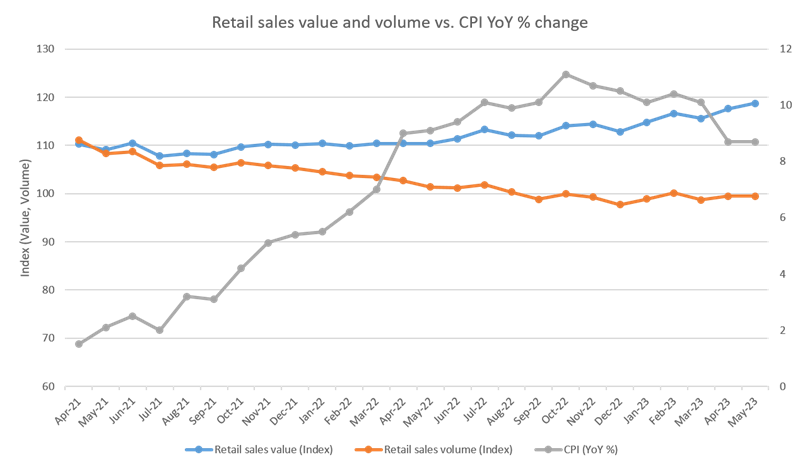
The divergence between the quantity of retail goods bought (volume) and the amount which is spent by consumers (value), has continued to deepen due to high levels of inflation which have led to marked price increases. Whilst CPI decreased in June, that has not yet lead to wider price decreases which would support the closing of this gap.

Overall, retail volume decreased by 1% in June 2023 against the previous year, whilst May 2023 showed a 1.9% decrease – this marks 15 consecutive periods of volume declines.

Retail value, on the other hand, increased 7.8% YoY in June 2023, as compared to a 0.8% increase in May 2022, and a 7.5% increase in May 2023.

Analysis and commentary prepared by Dominic Watkins and Eleanor Smith based on latest data released by the ONS. 

June '23 Market Monitor

The cost of living crisis continues to impact consumer spending. With inflation showing price increases of about 8%, we look at some of the pricing trends affecting the retail sector.
 
June '23 Market Monitor

CPI YoY% change

YoY change of CPI

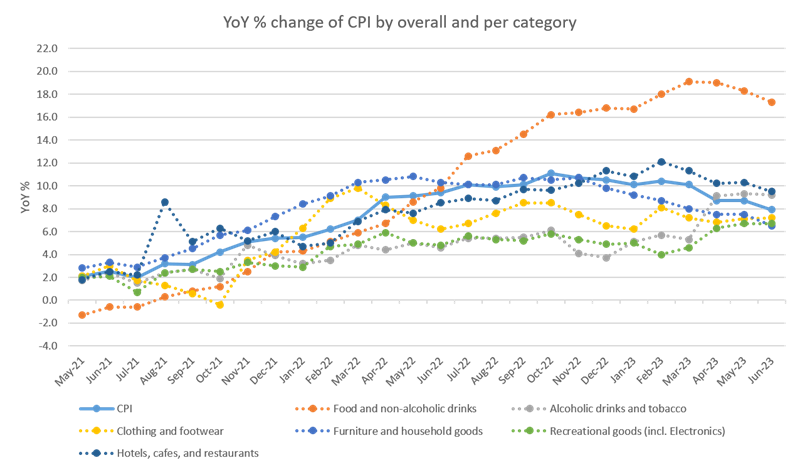
The Consumer Prices Index (CPI) increased by 8.7% during the year to May 2023, the same rate as in the previous month. The ONS commented: "A large upward effect from recreation and culture was offset by a large downward contribution from food and non-alcoholic beverages."

Food and non-alcoholic beverages annual inflation rate growth dropped by 70 basis points to 18.4% in the latest month, however this still reflects a significant level of price increases affecting consumer spend. Comparing against the previous month, the slowdown was driven by downward contributions in milk, cheese, and eggs. The price of fish – which the ONS added was "principally caused by a rise in the price of canned tuna" – was the only food class showing an uptick in rate growth.

Recreational goods reached their highest rate since August 1991, at 6.8% in May 2023. That was driven by an increase in live event ticket prices, video games, and package holidays. Elsewhere, both the household goods and clothing categories dipped to 7.5% and 6.8% respectively. Downward effects within household goods were provided by textiles (down to 4.3%), furniture (down to 8.2%), and tablewares (down to 2.2%).

Internet sales

 Internet sales by total

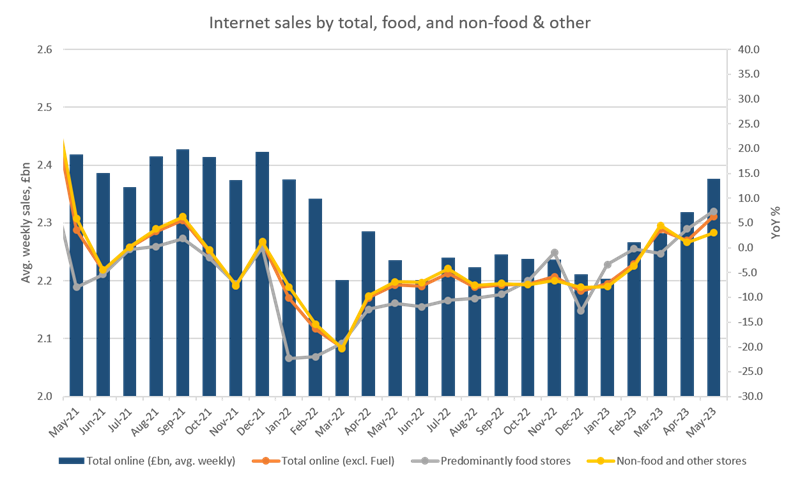
Internet average weekly sales increased 6.3% to £2.38bn in May 2023. A significant jump compared to the 1.5% growth reported in April, and up 58.2% versus the pre-pandemic February 2020 level. As a proportion of total sales, internet retailing accounts for approximately 26.5%, which is just 20 basis points below the May 2022 level, however remains firmly above the pre-pandemic level of 19.9%. 

Food store sales rose by 7.4%, whilst non-food and other stores saw a 3.0% increase. Clothing and footwear saw a rise of 15.4% against the prior year, which offset the 2.5% dip in household goods. The ONS commented: "[online] retailing sales volumes rose by 2.7% in May 2023, following a rise of 0.8% in April 2023. This was because of strong sales by online retailers selling outdoor-related goods and summer clothing."

Overall retail sales

 overall retail sales

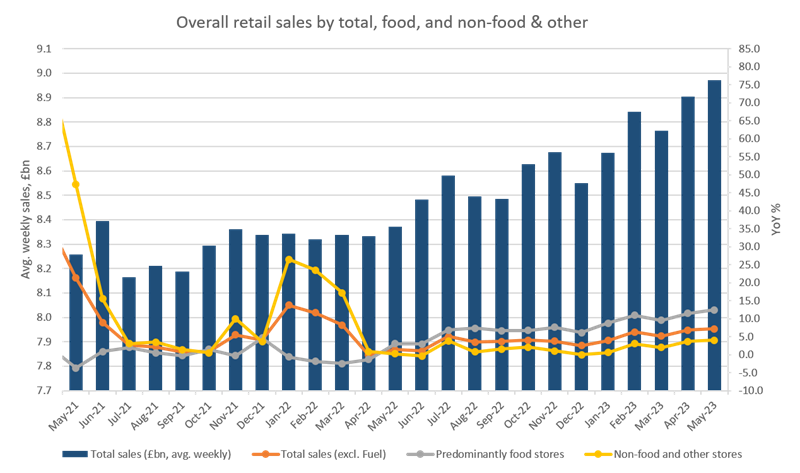
Overall, average weekly sales jumped up 7.2% to £8.97bn in May 2023, reflecting an 18.6% increase versus the pre-pandemic February 2020 level. However, this is partially due to the high level of inflation. Food store sales were up 12.5% in May, whereas non-food and other stores (including online sales) showed a 4.0% increase. Within this category, clothing and footwear saw a 6.7% increase whilst household goods remained the same.

Retail sales (value & volume) vs. CPI YoY% change

 Retail sales value

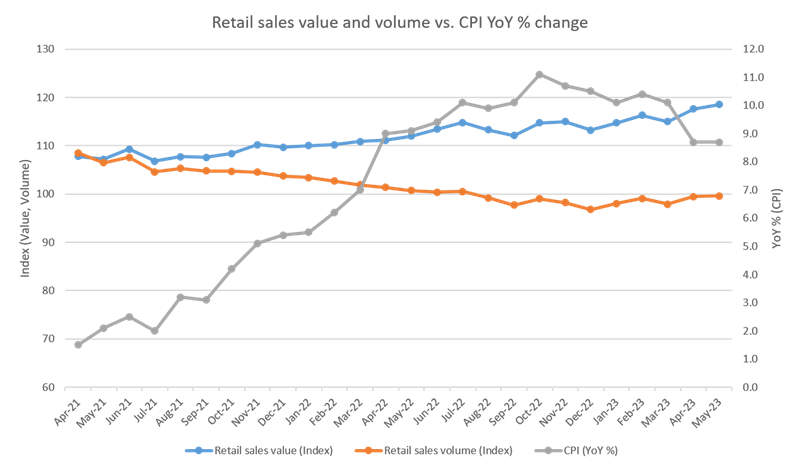
The divergence between the quantity of retail goods bought (volume) and the amount which is spent by consumers (value), has continued to deepen due to high levels of inflation which have lead to marked price increases. Whilst CPI decreased slightly in April 2023, and remained flat during May, the impact of this has not yet lead to wider price decreases – which would support the closing of this gap.

Overall, retail volume has decreased by 1.1% in May as compared to the previous year. In May 2022 the decline was 5.4% and dropped 1.9% dip in April 2023. This marks 14 consecutive periods of volume growth declines. Retail value, on the other hand, increased 5.8% year-on-year in May 2023, compared with a 4.5% increase in May 2022 and a 5.9% increase in April 2023.

Analysis and commentary prepared by Dominic Watkins and Eleanor Smith based on latest data released by the ONS. 

Key contacts

Contact us

Get in touch with a member of our team by using the details below or completing the form.

T +44 333 320 2220
F
+44 333 320 4440

E