


Summary
New claims intakes in the month of March were up across RTA, PL and EL, though in all cases by a margin which was less than the effect of an additional day's working time in the longer month of March. The increases were 3.0% with RTA, 1.4% in the case of PL and 1.2% for EL, all less than the 5.0% extra time.
Longer term trends for new RTA claims show clear stability: this has now been the case for the last 12 months over which these longer term measurements have shown 6 monthly increases to be set alongside the same number of monthly falls. Overall the reduction over 12 months for RTA is a nominal 0.05%.
The year to 31 March favoured by the DWP for their data (the release of which for 2018/19 is still awaited) shows 696,258 new RTA claims, a token reduction only of 2,496 or 0.4% from 2017/18 levels. This can be contrasted with a reduction of 12.0% in the annual data seen at this stage a year ago. New RTA claims levels are currently particularly stable despite uncertainties from the incoming reforms.
EL and PL longer term trends are currently pointing more towards the negative. EL shows a reduction of 1.7% over the last year and PL demonstrates a fall of 2.6%. While both have seen some monthly increase in numbers in the last 12, those months are outnumbered by others showing monthly decreases.
EL disease claims show substantial and increasing rates of declining usage of that portal both in the data for the month of March and longer term.
There is increasing stage 3 usage this month with both RTA and PL, though EL has declined. Proportionately stage 3 use remains at around 30% for RTA and at around 10% for PL/EL.
The 15th edition of the Judicial College Guidelines is currently expected in September and is particularly anticipated in the case of RTA claims in view of their impact on non-tariff injuries in cases involving whiplash injury which are affected by the incoming Civil Liability Act reforms.
PSLA levels in RTA are reduced for a third consecutive month to the lowest level since April 2018 as the focus for claimant operations may currently lie away from damages levels. Current increases over where quantum stood at the time of the 14th edition are only 1.2% for RTA, 1.4% for PL and 2.9% for EL where the guidelines themselves proposed increases of 4.8%.
New RTA claims in March
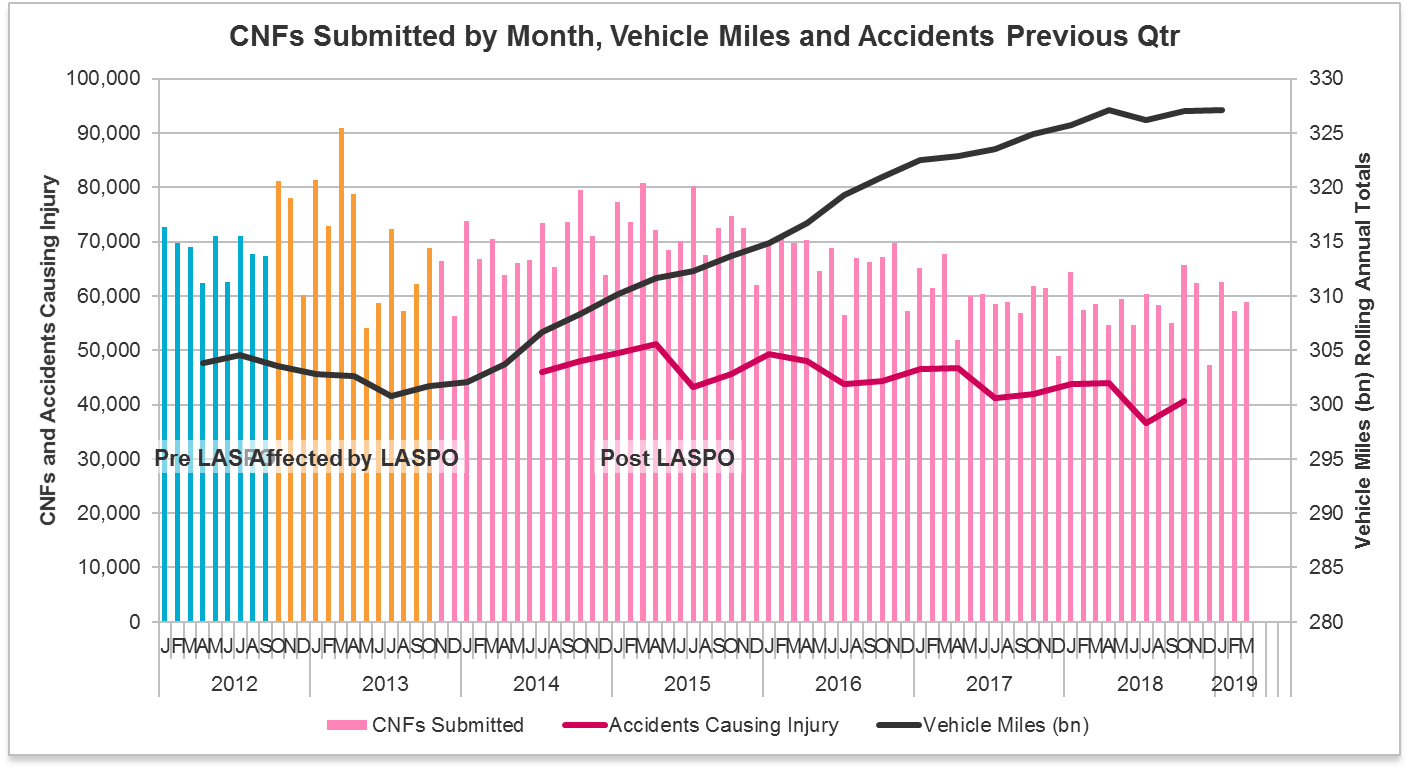
In March 2019 there were 58,854 new RTA claims, which level represents an increase of 3.0% over February's total of 57,138.
Usually, but not always, we see an increase in volumes between the months of February and March. In 2018, it was 2.0% and in 2017 we saw a larger increase of 10.2%, though in 2017 there was a reduction of 2.3%.
March 2019 is the lowest March intake since the RTA portal opened, with the exception of March 2018. Last month is therefore an increase of 0.6% over March 2018, but a reduction of 13.0% from March 2017 and 15.5% below March 2016.
After 3 months of the calendar year 2019 the average monthly intake now stands at 59,517. That is a level 2.2% higher than the 2018 monthly average of 58,244. It is though a 0.9% reduction from the average for the first 3 months of last year, which stood at 60,050.
New RTA claims in March – time weighted
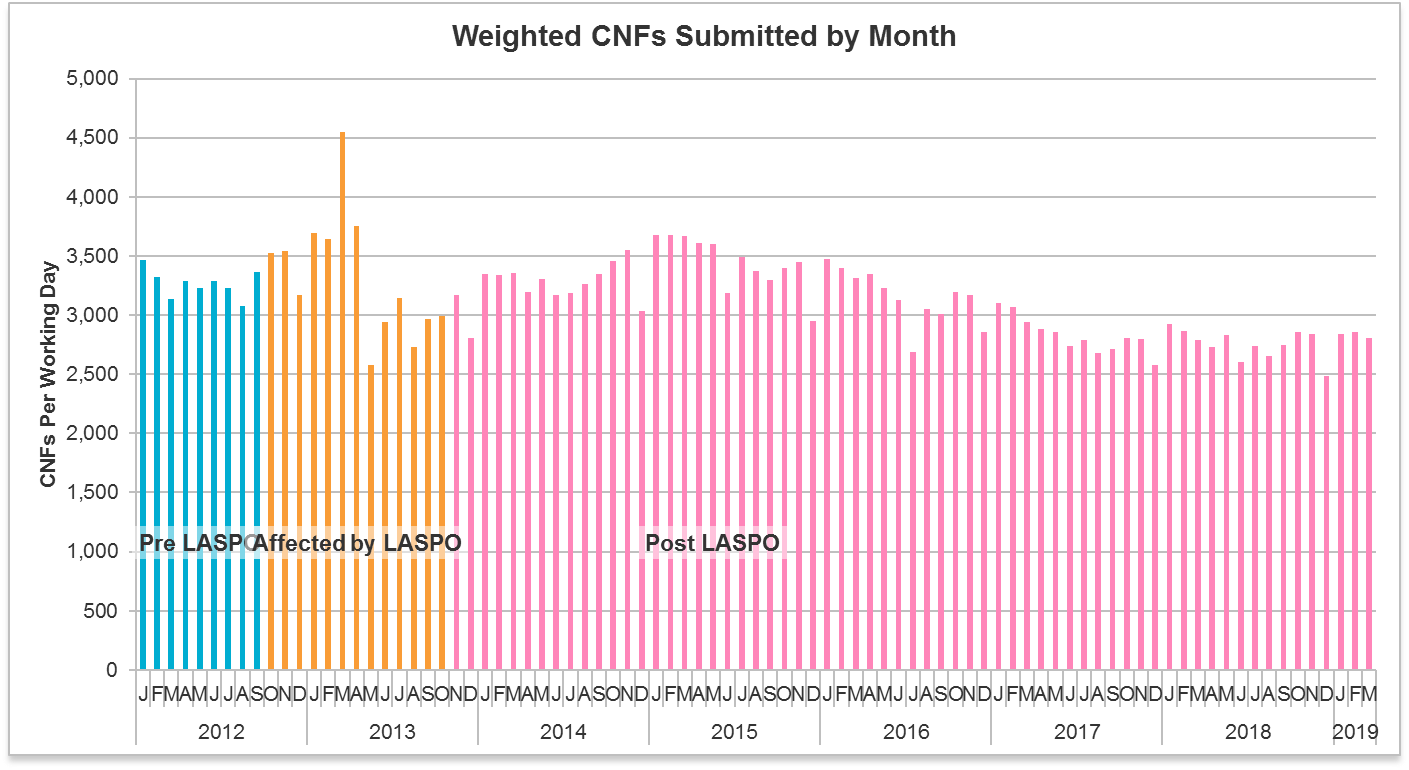
There were 21 working days in March, a 5.0% increase from the 20 working days in February. The month on month increase in new volumes of 3.0% can therefore be fully explained by the increase in working time of more than that amount.
There were therefore 2,803 new RTA claims per working day during the month of March. This is a reduction from the 2,875 claims per working day seen in February.
With the exception of December, the period between October 2018 and February 2019 had shown an increase in the daily intake of new claims back towards the level seen at the beginning of the calendar year 2018. Adding the data for the month of March makes it more slightly more difficult to see a continuation of that trend.
There remains no short-term prospect of an increase in the daily number of new RTA claims back over 3,000, a level last seen in the initial months of 2017.
New RTA claims over the longer term
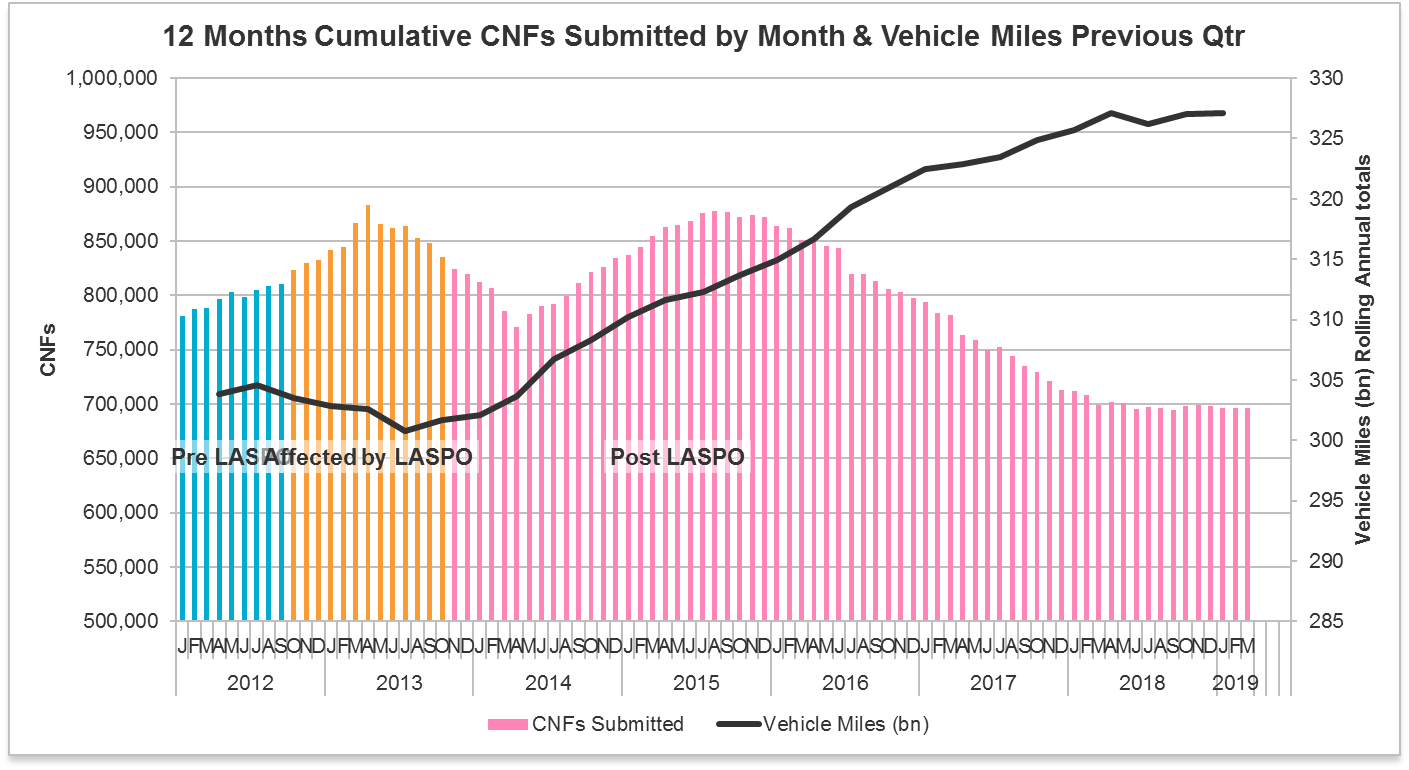
Looking at longer term trends on the 12 month cumulative basis, we see from the graph above that the picture of stability which began in March 2018 has now extended for 12 months. Over that period there have been 6 monthly increases, and 6 monthly decreases.
Over the month, the data has increased from 695,904 to 696,258, a rise of 0.05%.
Over the last 12 months, the stability can be seen from the fact that the variation is within a range of only 1% or 6,500, with the parameters of that range being 694,500 to 701,000.
Over the last 12 months since March 2018, there has been a nominal decrease of 0.4% where in March 2018 the number stood at 698,754. Over the previous 12 months between March 2017 and March 2018 the fall was much larger at 10.6%.
As to the operation of the portals, it is fair to recognise that the opportunity to see stabilised data is more clearly found with the RTA portal and its higher levels of claims handled within it, but at the same time it is nevertheless clear that the factors that might have caused either an increasing or a decreasing trend as has been usually found even with the RTA data in the past, do not currently exist.
It seems to be the case that the RTA market is currently able to operate in such a way that notwithstanding the forthcoming changes to be introduced by the Civil Liability Act and the associated Small Claims Track reforms, that RTA claims have continued to be presented in broadly equal numbers over the last 12 months.
Comparison with annual portal and CRU data
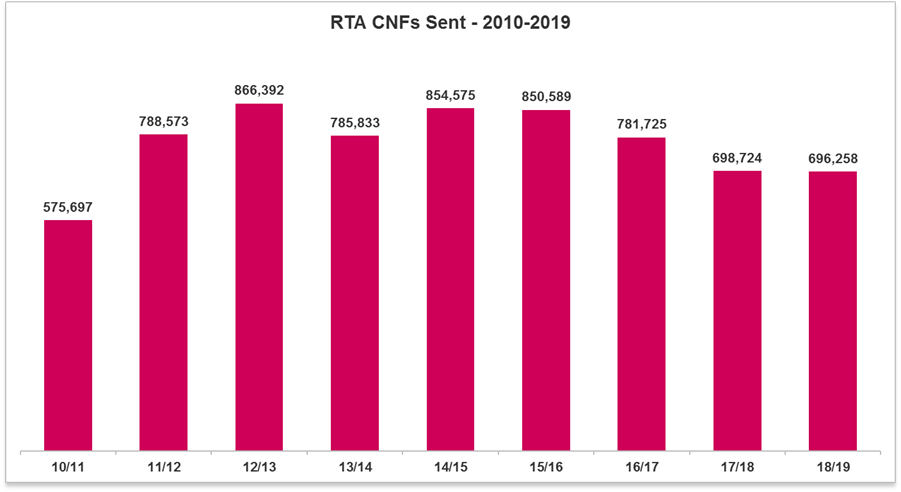
We have now concluded the accounting year to the end of March 2019 as used by the DWP in their annual CRU claims data. The 2018/19 portal total reached 696,258 new RTA claims.
The confirmed total for 2017/18 stood at 698,754. 2018/19 is therefore marginally lower by 2,596 or 0.4%.
The 0.4% reduction is what we were anticipating to be the concluding position for 2018/19 when looking at the data as it then stood at the end of February. We expected then that there would with the addition of March's data be a nominal reduction when 2018/19 finally closed, and so it has proved.
As the preceding graph shows, when 2017/18 was compared to the prior year of 2016/17 there was a sizeable fall of 12.0%. The comparison which we can now make between 2018/19 and the previous year should again be seen to point towards a stable level of the intake of new claims between the two accounting years, both below a figure of 700,000 by only a small number of claims.
In April 2018, the DWP released the CRU total for the year to 30 April 2018, which reached 650,019. It is likely that the DWP will release their total for 2018/19 later this month. The portal total for 2018/19 at 696,258 stands at 7.1% higher than the CRU figure for 2017/18, and it may well prove to be the case that because of the different means of collecting the data that the portal total for 2018/19 is similarly higher than the CRU figure for the same period. We will see shortly.
New casualty claims in March
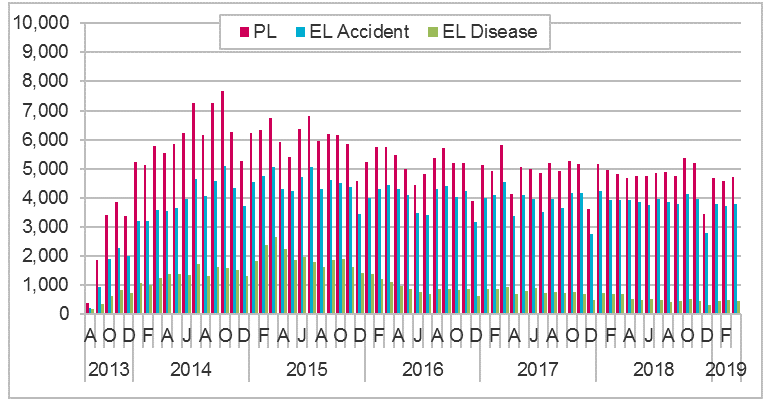
PL claims
There were 4,722 new PL claims in March, an increase of 1.4% over the 4,656 seen in February. At 1.4% the increase is though less than the 5.0% increase in working time and so amounts to a real time reduction.
Whilst an increase between February and March might be expected, in 2018 there was a decrease of 2.7%, in 2017 an increase of 18.3% and in 2016 a fall of 0.1%.
March 2019 is the lowest figure for new PL claims in any March since the casualty portals opened. It is less than in March 2018 by 2.1%, lower than in March 2017 by 18.6% and 18.1% below March 2016.
The current average new claims intake for the calendar year 2019 now stands at 4,684. This is 2.5% below the 2018 monthly average of 4,806, and is 6.0% less than the average for the first 3 months of 2018 which stood at 4,981.
EL claims
March saw 3,786 new EL claims, an increase of 1.2% over the 3,742 which entered in February. The increase is again less than the additional working time available however.
Usually, but not always, there is an increase at this time of year when the month of March is compared to February. In 2018, there was a decrease of 0.2%, but in 2017 an increase of 10.8% and in 2016 a rise of 3.6%.
Apart from March 2014 when the casualty portals were in their first year of operation, this is the lowest March for recorded numbers of new EL claims. The current level is 3.6% below March 2018, 16.7% less than in March 2017 and is under the number seen in March 2016 by 15.3%.
Over the calendar year 2019 to date the monthly average for new EL claims now stands at 3,773. This is 1.9% below 2018's average of 3,847, and is 6.5% less than the average for the first 3 months of that year when the figure was 4,034.
EL disease claims
There were 431 new EL disease claims in March. Even with the increase in working time there is a decrease which in fact represents a decrease of 10.0% over the month.
As between February and March in previous years, in 2018 there was an increase of 1.6%, in 2017 a rise of 10.2%, but in 2016 a drop of 10.0%.
March 2019's intake is the lowest for any March since the casualty portals opened. The current level is 37.2% below March 2018, 54.2% less than in March 2017 and it also amounts to a reduction of 60.8% from March 2016.
The average monthly EL disease intake for the calendar year 2019 now stands at 451. This is a reduction of 12.8% from the 2018 monthly average of 517 and is 34.8% less than the average for the first 3 months of 2018 which was 692.
New casualty claims over the longer term
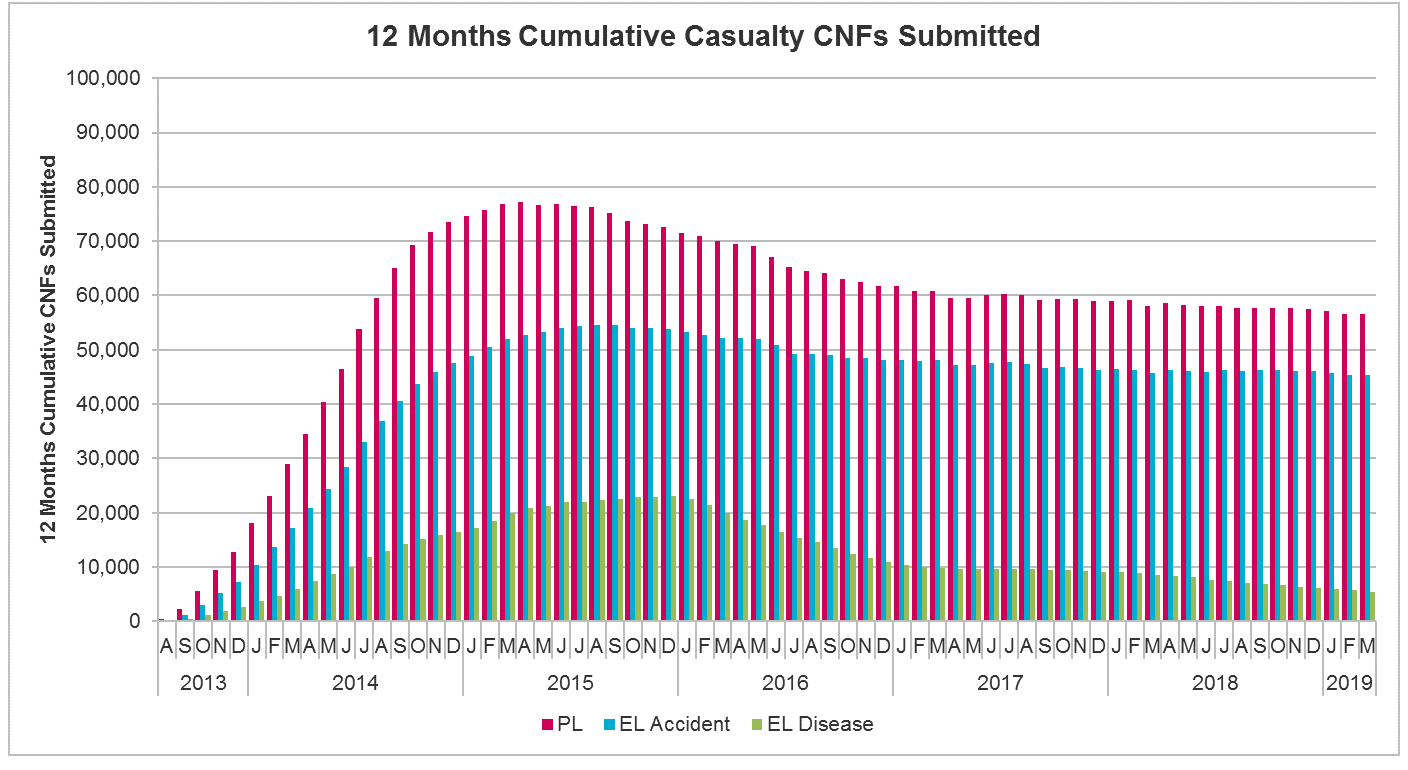
PL claims
Looking at longer term trends on the 12 month cumulative data, adding the March intake shows 56,576 new PL claims during the last year, which represents a 0.2% fall from the 56,677 seen over the 12 months to the end of February.
Over the 12 months since March 2018, there has been a decrease of 2.6%. During those 12 months, there have been 3 monthly increases set alongside 9 monthly falls. Between March 2017 and March 2018 the decrease was 2.1%, so the fall of 2.6% over the last 12 months suggests the rate of decline has increased.
The average monthly decline during the calendar year 2018 was 0.2%. 3 months into 2019 the average monthly fall is now 0.6%, still 3 times higher, suggesting a faster rate of decline in the early months of this year.
EL claims
On the same cumulative basis up until the end of March, there were 45,277 new EL claims, which amounts to a reduction of 0.3% over the position as at the end of February when the number stood at 45,420.
Over the last 12 months there has been a decrease on this longer term measurement of 1.7%, and over those 12 months we have seen 4 monthly increases but 8 monthly decreases. Comparing 2018/19 to 2017/18, the rate of decline has slowed, because over the earlier period the reduction was 4.9%.
The 2018 average decline on this measurement was a nominal 0.2%, whereas it is now somewhat greater at 0.6%, the same level as for PL.
EL disease claims
On the same form of assessment there were 5,449 EL disease claims over the 12 months to the end of March, a reduction over the month of 4.5% from 5,704 where the data stood at the end of February.
Over the last 12 months there has been a decline on this means of assessment of 32.7%, with every month showing a decrease for over 3 years. The rate of decline has increased because over the prior 12 months, in 2017/18, the decrease was 13.3%.
The rate of decrease has also increased in 2019 to date: the monthly average fall in 2018 was 2.7%, whereas for the first 3 months of this year it is 4.0%.
Retention rates
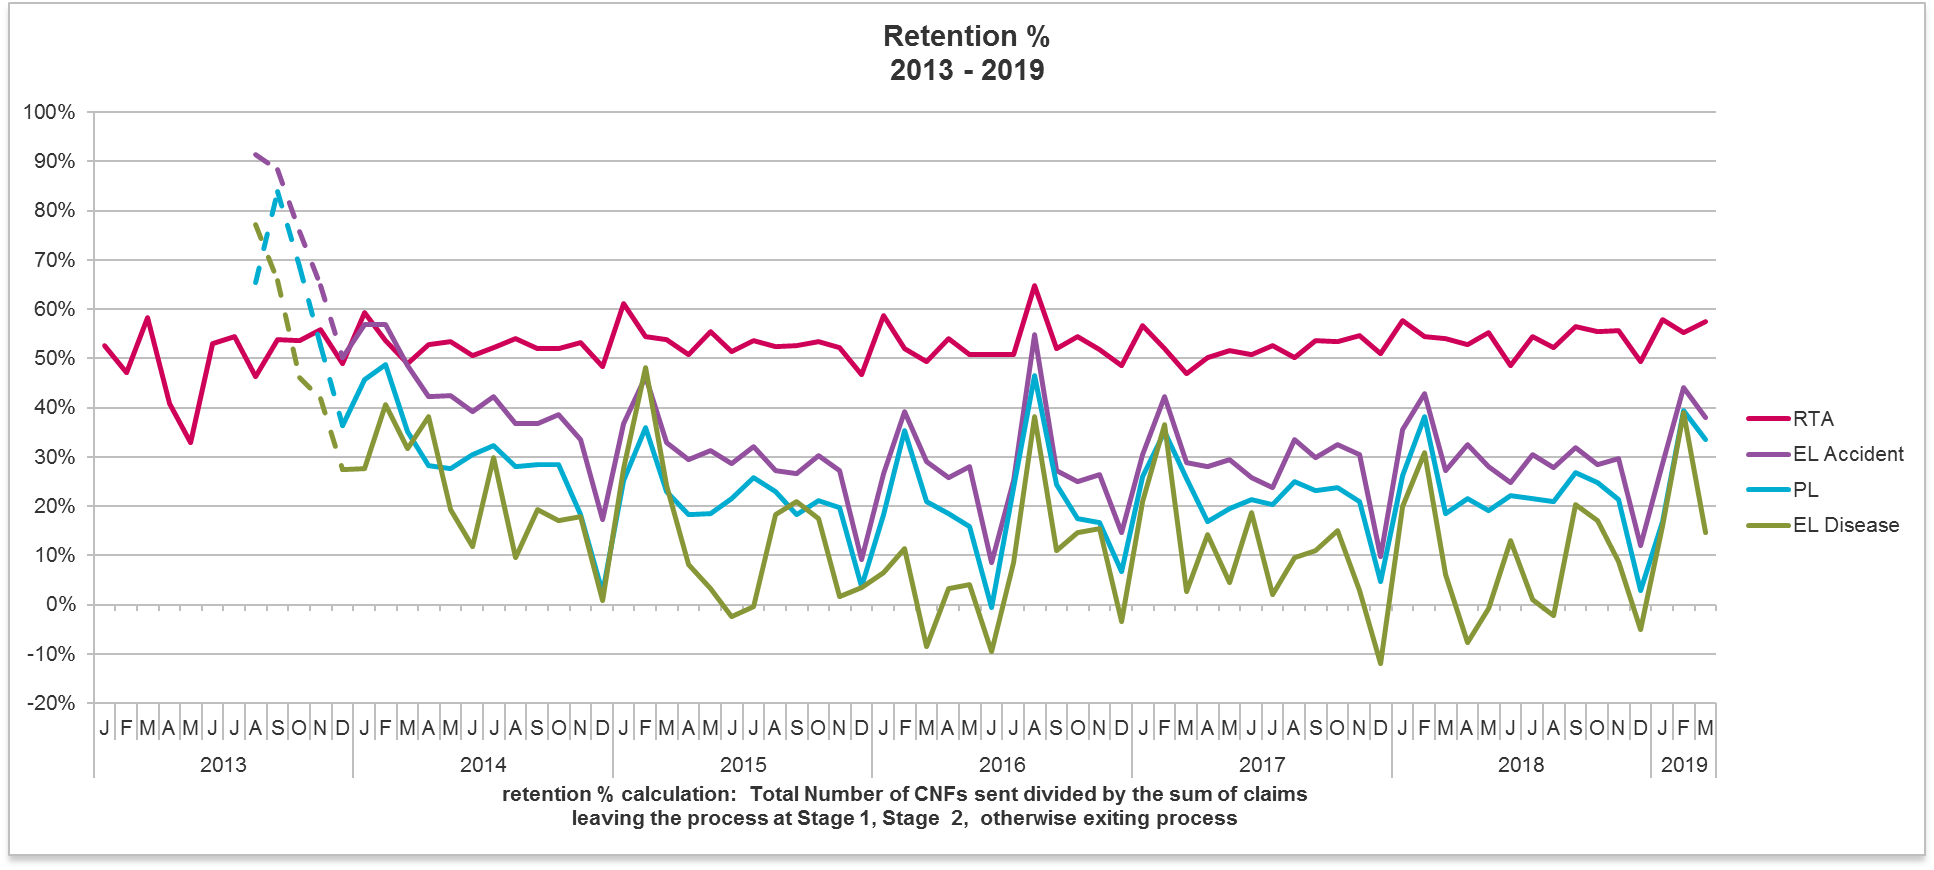
In March we saw an increased retention rate in RTA, but falling rates in all 3 casualty portals, significantly so in the case of EL disease.
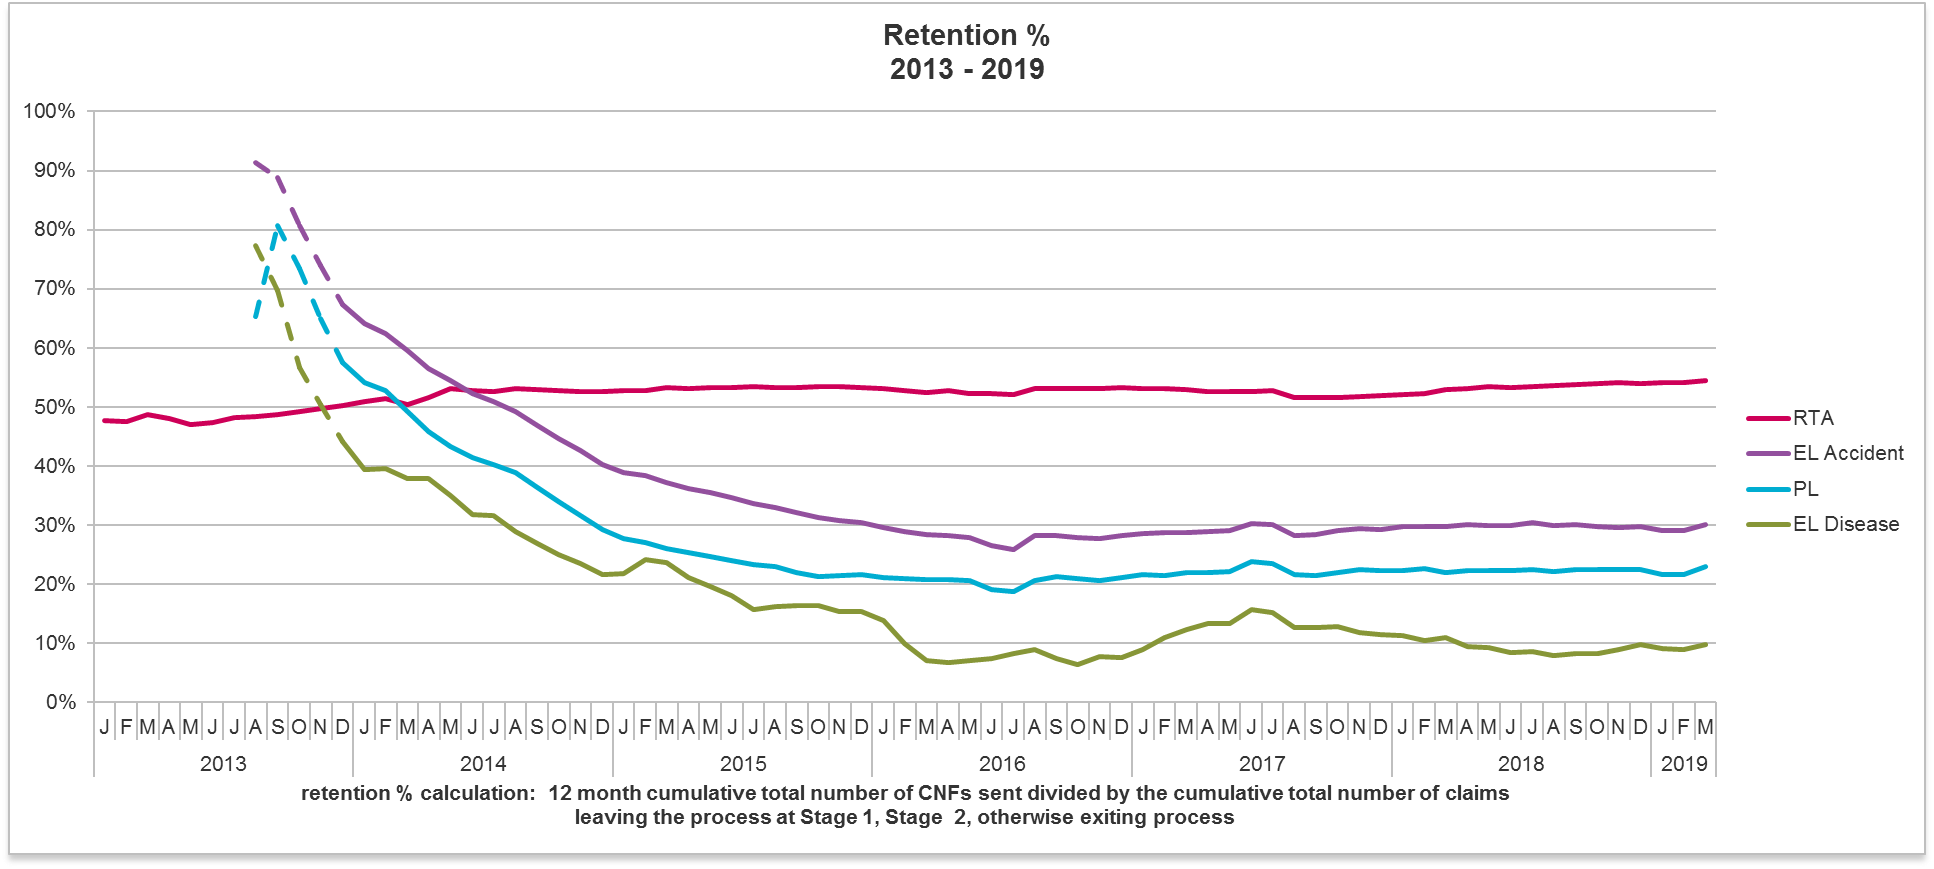
Looking at the 12 month cumulative data for longer term trends, we see marginal increases across the board. RTA is now approaching 55%, EL has increased to 30%, PL has risen to 23%, while EL disease has been raised to 10%.
Both of the above graphs assume that claims proceeding to stage 3 should be regarded as included within the portal process. See also the comment made at the conclusion of this update as to the new means by which Claims Portal is presenting its data this month.
RTA claims – stage 3 usage and PSLA levels
Stage 3
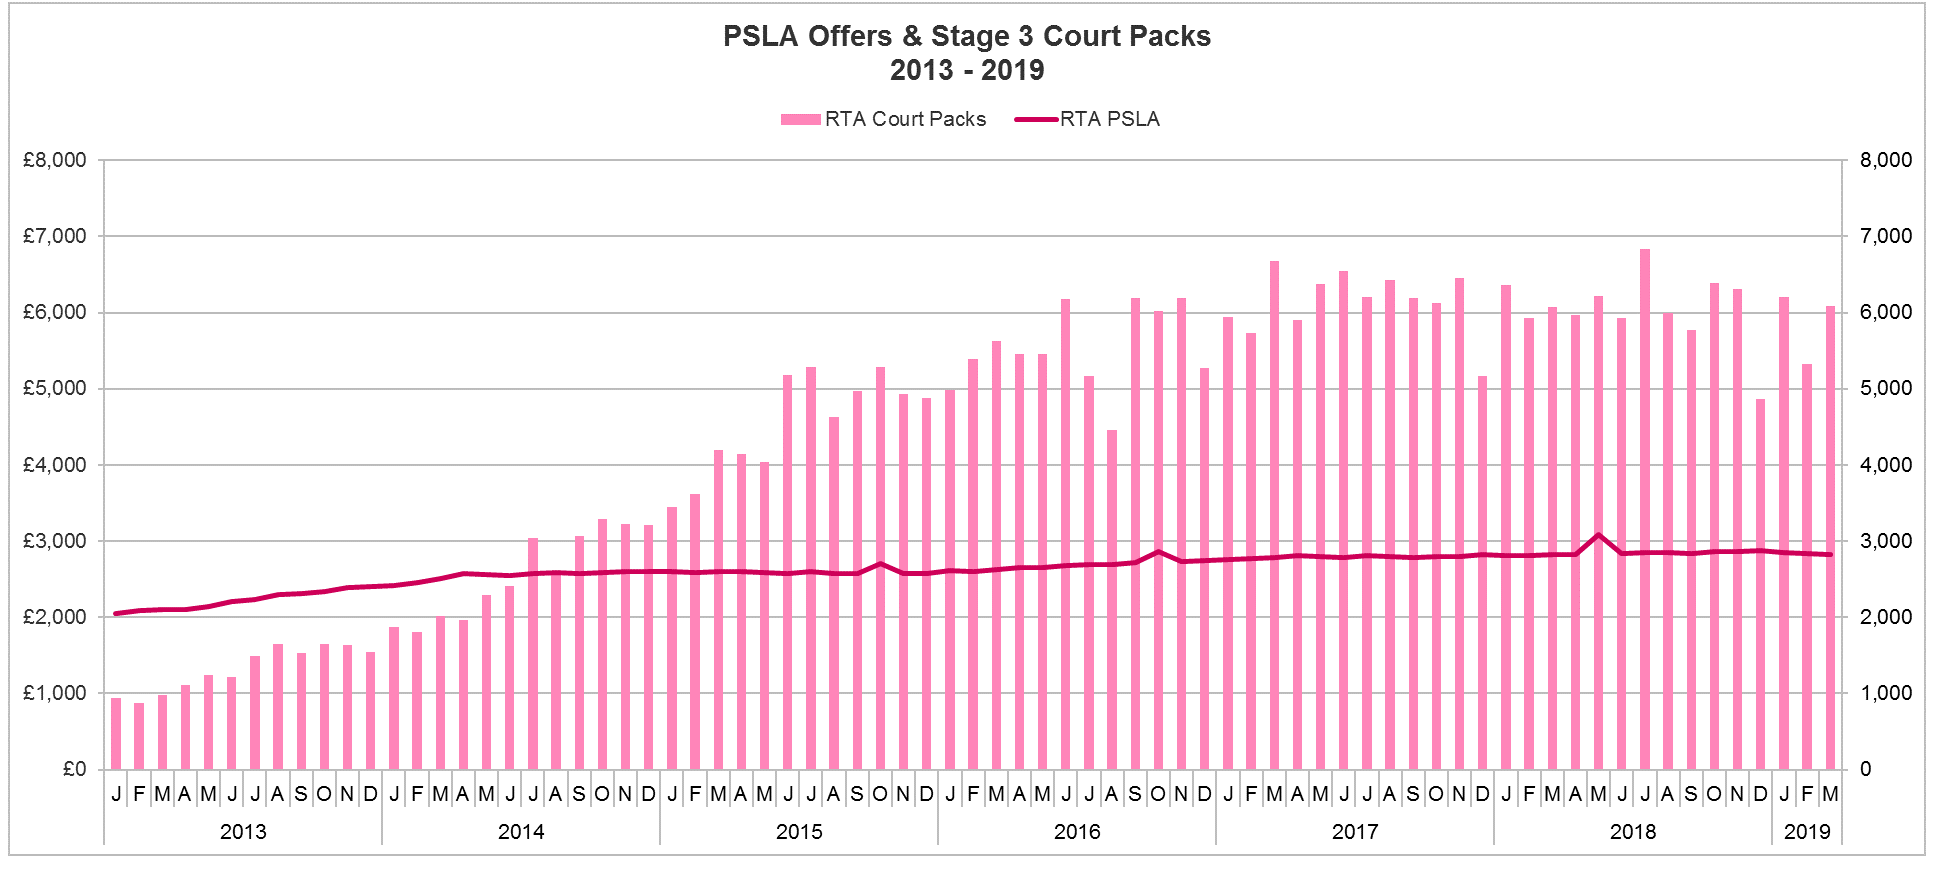
March saw 6,083 RTA claims in which a court pack was prepared as a preliminary step to use of stage 3. This constitutes a rise over the month of 14.3%. It should, however, be recognised from the graph above that the data has been volatile over the last 4 months. Indeed, we saw last month a 14.1% decrease from January's level.
In 2019 to date, there has been a monthly average court pack number of 5,869, which represents a 3.0% decrease from 2018's monthly average of 6,052. The current level is also lower by 4.1% than the average for the first 3 months of the last year which stood at 6,120.
PSLA levels
The average general damages level in March was £2,827, a decrease of 0.2% over the month from a prior level of £2,833. This is the third consecutive monthly fall, and March's number was the lowest for nearly a year since April 2018.
The current level is now only 1.2% above November 2017, when the 14th edition of the Judicial College Guidelines are thought to have started impacting. Those of course recommended average PSLA increases of 4.8%.
Work is currently ongoing say the Oxford University Press on a 15th edition of the Guidelines, which are expected to be published by them in September of this year. The level of damages for non-tariff injuries lasting up to 2 years in claims where there will also be a whiplash element the value of which will be assessed on the tariff will be important where adverse behaviours from claimant operations may otherwise limit the anticipated effect of the reforms. There is reason to say that the value of non-tariff injuries should be calibrated in the light of the approach taken to the setting of the tariff for injuries falling within it.
There does not seem to be from this evidence a current focus on the part of claimants' representatives to maximise damages, rather the focus of their current efforts appears to lie elsewhere such as in relation to costs and disbursements.
Casualty claims – stage 3 usage and PSLA levels
Stage 3
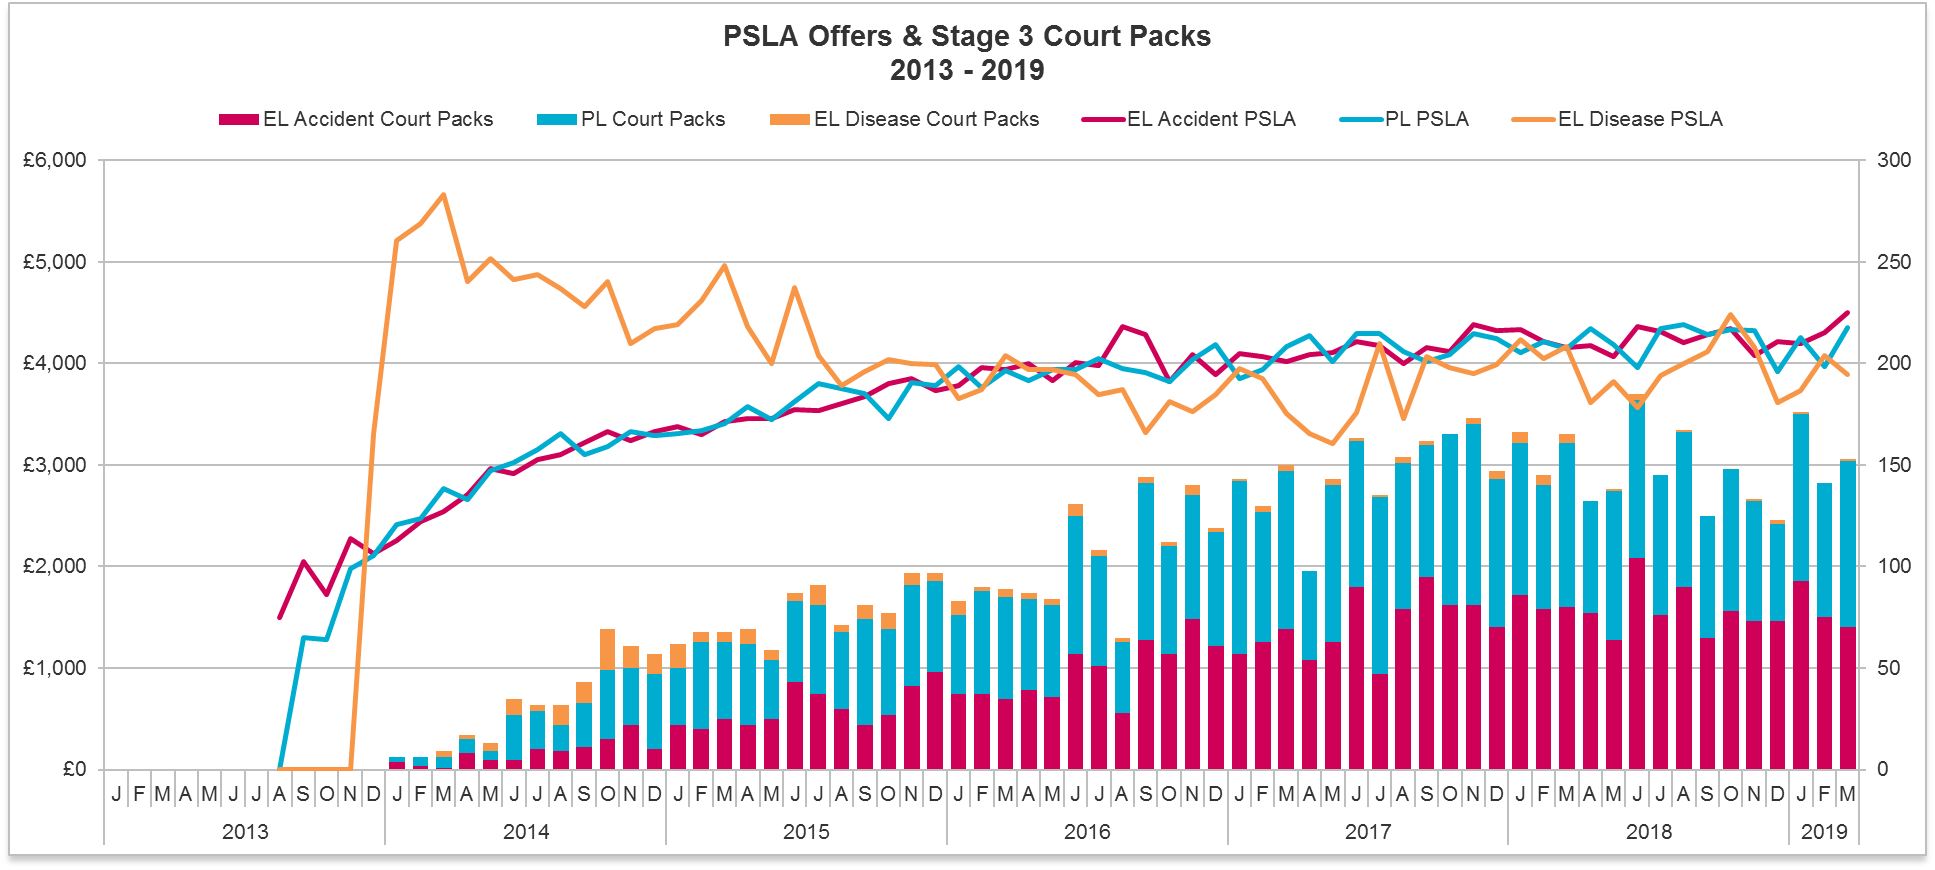
In the case of PL, there were 82 court packs in March, the same number as in January, after a decrease to 66 in February. March is the equal fourth highest month to date for PL court packs. The average number of PL court packs during 2018 was 67, so March was 22.4% above that level.
In the case of EL, there were 70 court packs prepared in March, a reduction from the 75 in February, and the lowest number since September 2018. The 2018 monthly average was 79, so March's level was 11.4% below that.
As to EL disease, there was 1 court pack prepared in March, as opposed to the 0 in February. The 2018 average was 2, so March's level was 50% of that.
PSLA levels
Over the month PL PSLA rose to 9.7% from £3,971 to £4,356, the second highest ever level, and 1.4% above when the Judicial College Guidelines 14th edition began to impact in November 2017.
As to EL, levels rose 4.7% from £4,303 to £4,505. The current level is 2.9% above November 2017.
In the case of EL disease, however, on a small sample size, average PSLA fell 4.5% from £4,075 to £3,890. EL disease shows no increase from the level which applied at the time of the 14th edition.
Comparative use of stages 2 and 3
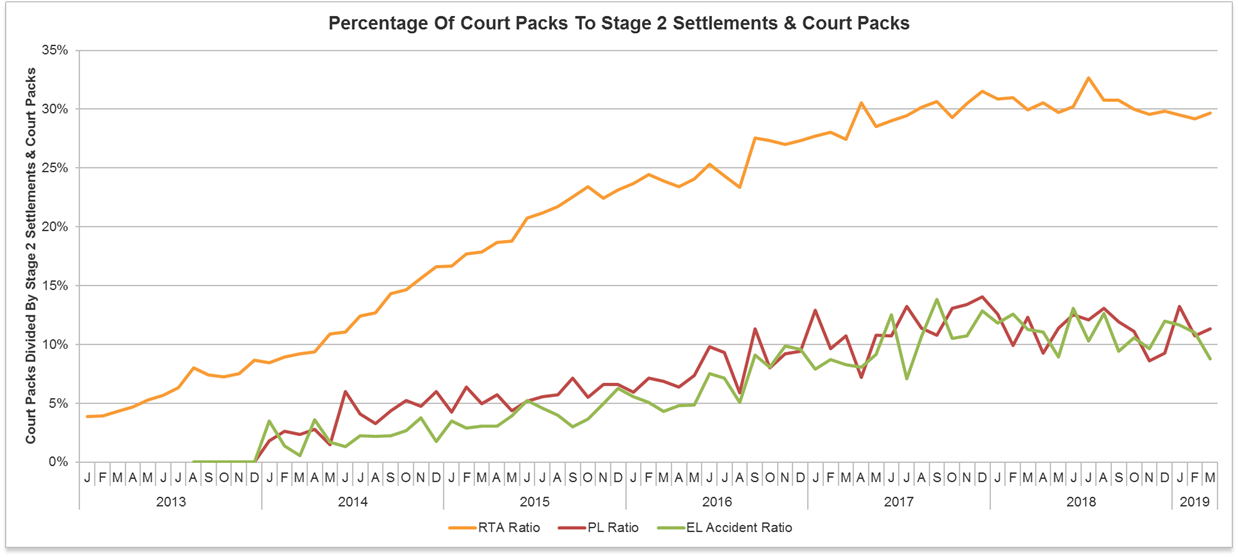
Over the month RTA proportionate stage 3 usage has increased back to the level of 30%, while PL has increased to 12% at the same time as EL has fallen to 9%.
In broad terms, over the last 12 months or so, RTA stage 3 usage has remained at around 30%, with EL and PL at around 10%. That is, use of stage 3 is 3 times more popular in the RTA portal than it is in the main 2 casualty portals.
Presentation of the data
For the first time since the portals were established, Claims Portal has moved to an alternative means of presenting their monthly data for the 4 Portals this month. There is a new dashboard, with monthly totals for key data, together with rolling numbers representing totals over the period since each portal opened.
3 principal graphs are seen as important by Claims Portal, these are for CNFs entering each portal presented on a rolling 12 months basis, court packs submitted, and average general damages levels. All of those are criteria analysed in our monthly reports as in this update.
It has to be said that there is some divergence on certain points between the data as now presented, and as it appeared when first presented under the old MI system. Whilst some of the graphs presented in this update as based on the new MI contain some minor differences with those graphs previously drawn up on the basis of the former system of data collection, the differences are not significant to the overall conclusions of the update.
Contact
For more information please contact Simon Denyer, Strategic Legal Development Consultant Simon.Denyer@dwf.law