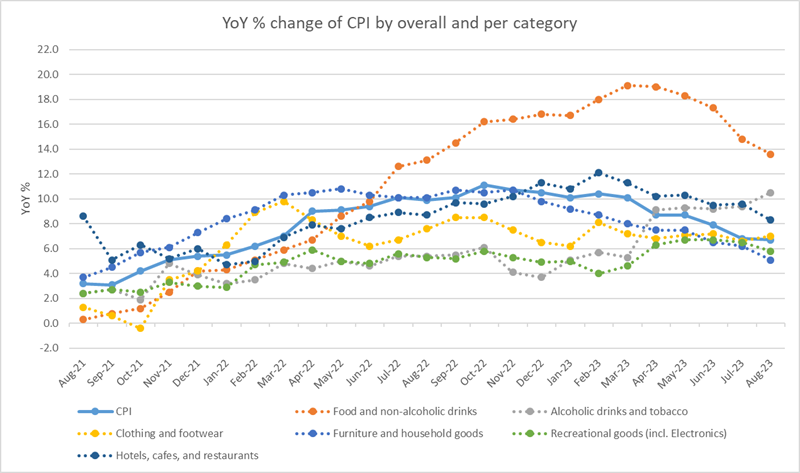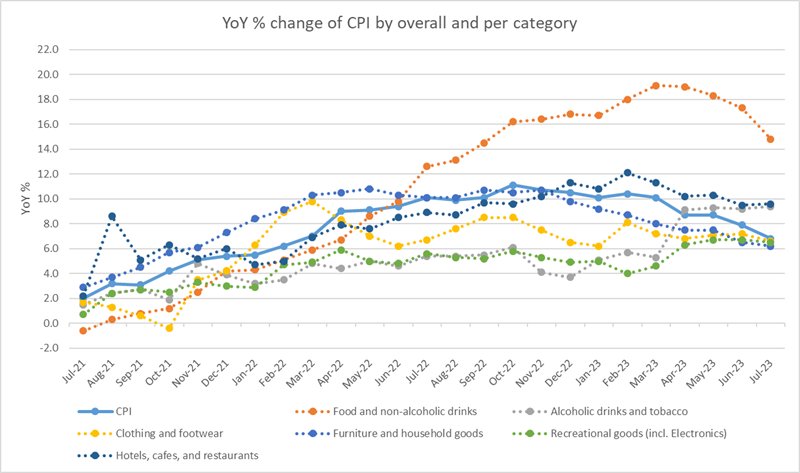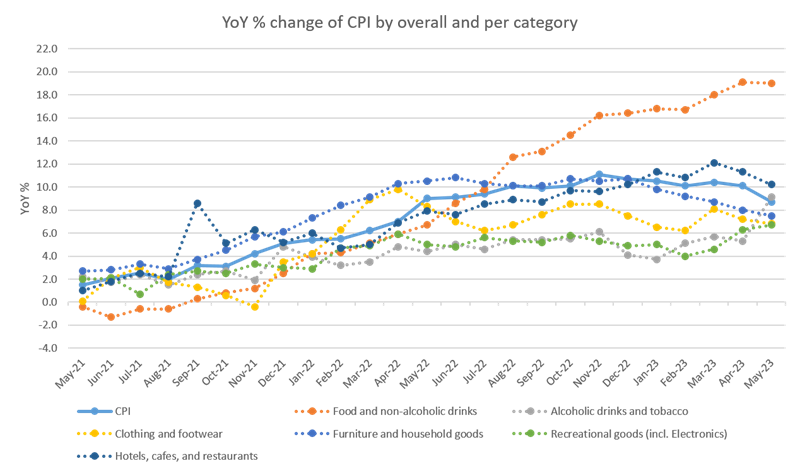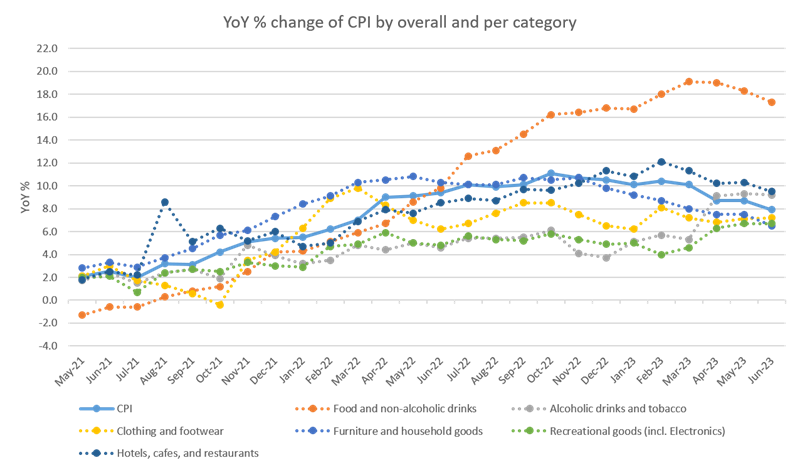
The Consumer Prices Index (CPI) increased by 7.9% during the year up to June 2023, a notable dip of 80 points compared with the previous month. However, month-by-month CPI rose by 0.1%, albeit much lower than the 0.8% monthly rise in June. The ONS commented: "Falling prices for motor fuel led to the largest downward contribution to the monthly change in CPIH and CPI annual rates, while food prices rose in June 2023 but by less than in June 2022, also leading to an easing in the rates… There were also notable downward effects from food and non-alcoholic beverages, furniture and household goods, and restaurants and hotels."
Food and non-alcoholic beverages annual inflation rate growth dropped by 100 points to 17.4% in the latest month. Whilst still the highest level in the past decade, this marks improvement from the recent 19.2% in March 2023. The largest downward contributions continued to be driven by milk, cheese, and eggs but supported by smaller effects in meat, bread and cereals.
Similarly, furniture and household goods dropped by 100 points to 6.5%, as four of the five elements within this sector eased significantly. Furniture, furnishings, and carpets dropped from 8.2% in May 2023 to 6.4%; textiles from 4.3% to 3.8%; appliances from 6.2% to 5.1%; glassware and utensils from 2.2% to 1.9%; and household and garden tools from 5.6% to 5.3%.
All other major sectors showed smaller movements between May and June 2023. For example: hotels, cafes and restaurants decreased by 80 points to 9.5%, alcoholic drinks and tobacco by 10 points to 9.2%, clothing and footwear increased by 10 points to 7.2%, and recreational goods remained flat at 6.7%.
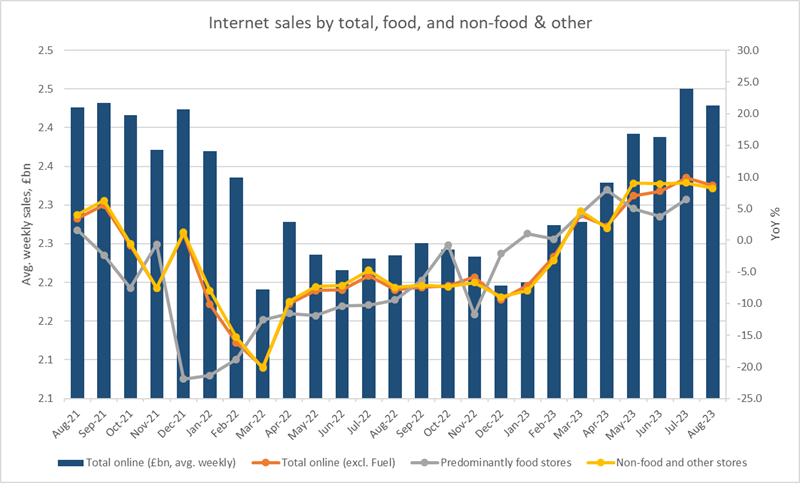
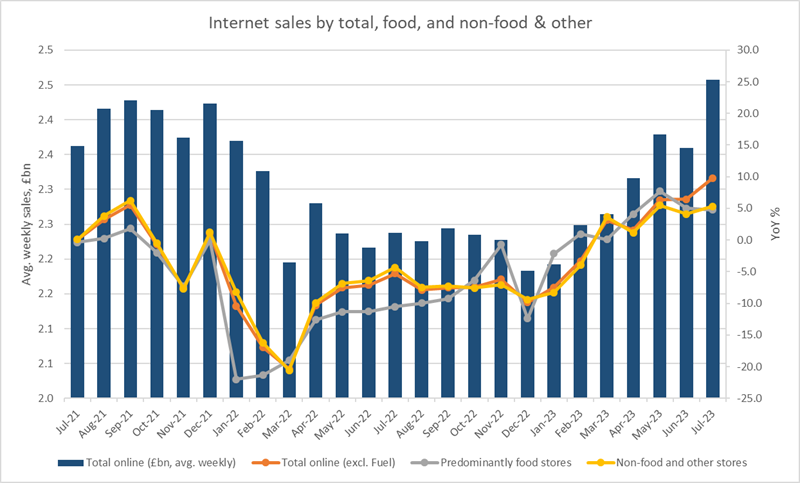
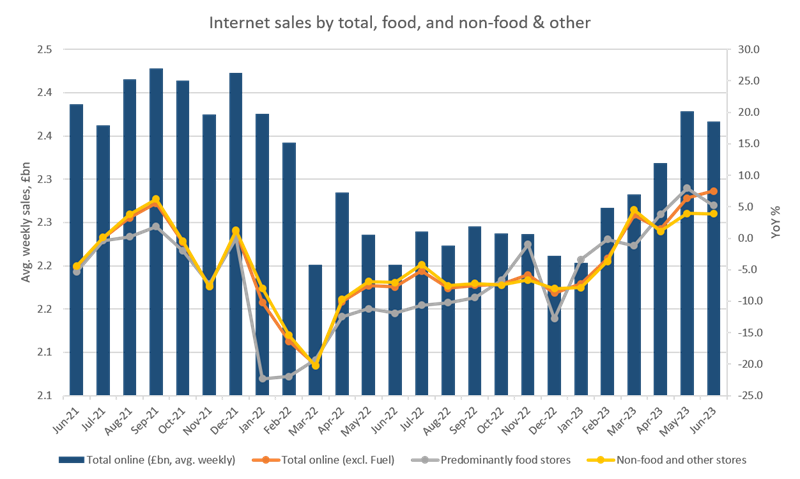
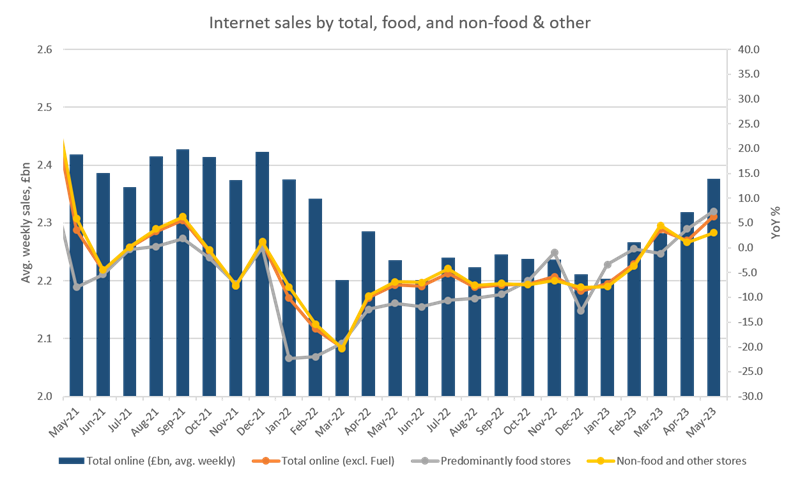
Internet average weekly sales increased 7.5% to £2.37bn in June 2023, a slightly higher year-on-year level versus the 6.4% in May, and up 57.5% versus the pre-pandemic February 2020 level. As a proportion of total sales, internet retailing accounts for approximately 26.0%, similarly as in June 2022, but remains much higher than the pre-pandemic level of 19.9%.
Food store sales rose by 5.2%, whilst non-food and other stores experienced a 3.9% increase. Clothing and footwear jumped 11.4% against June 2022 level and we saw a 6.1% increase in household goods. The ONS stated: "Online spending values fell by 0.5% in June 2023 because of monthly falls in clothing and food stores as they returned to previous levels following increases last month."
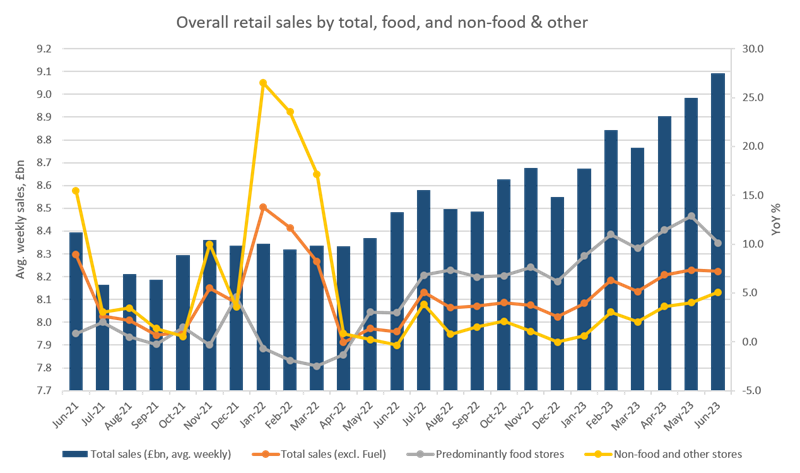
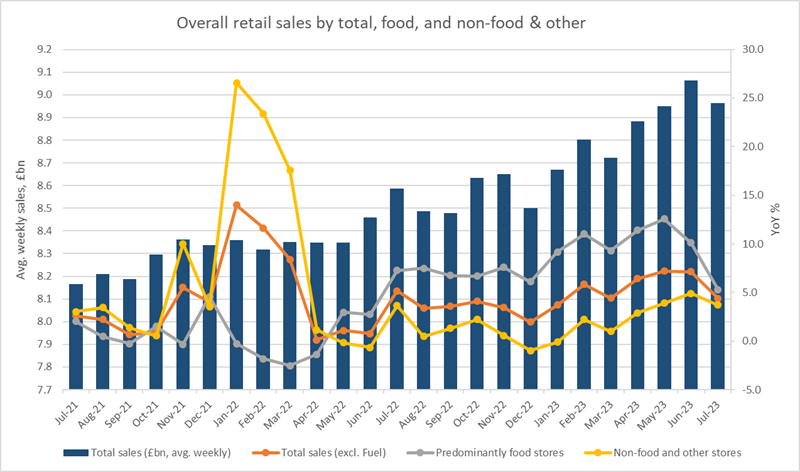
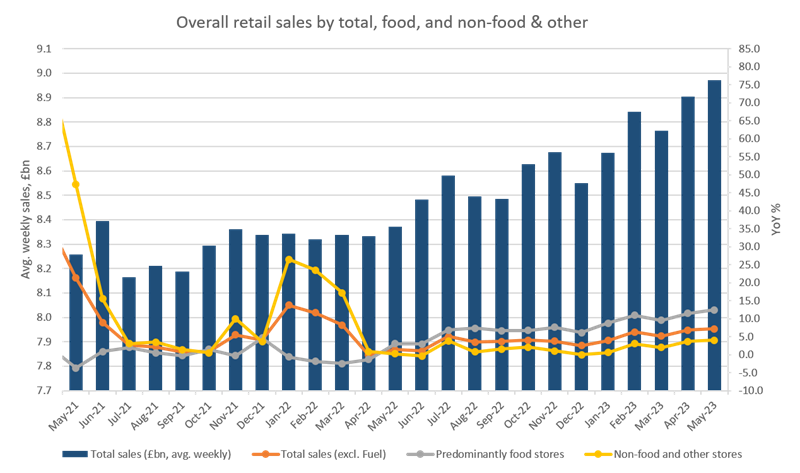
Overall, average weekly sales increased 7.2% to £9.09bn in June 2023, reflecting a 20% increase versus the pre-pandemic February 2020 level. Yet, this is due in part to the current high level of inflation. Food store sales saw a 10.1% increase, whereas non-food and other stores (including online) showed a 5.1% increase. Within this sector, clothing and footwear increased 9.1% whilst household goods went up 5.3%.
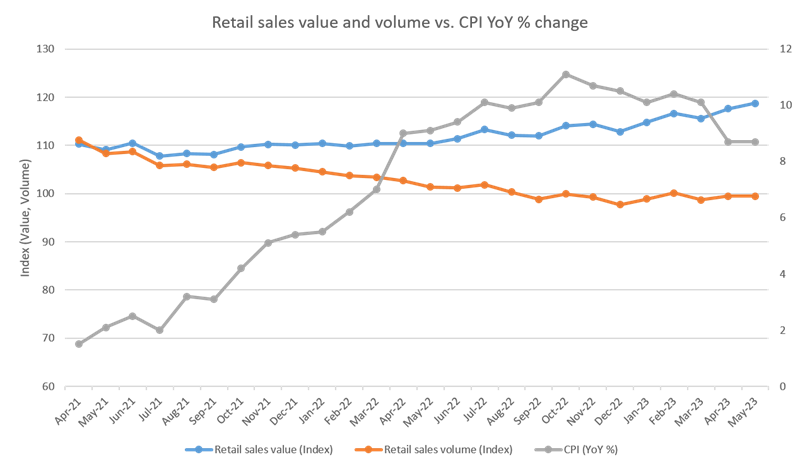
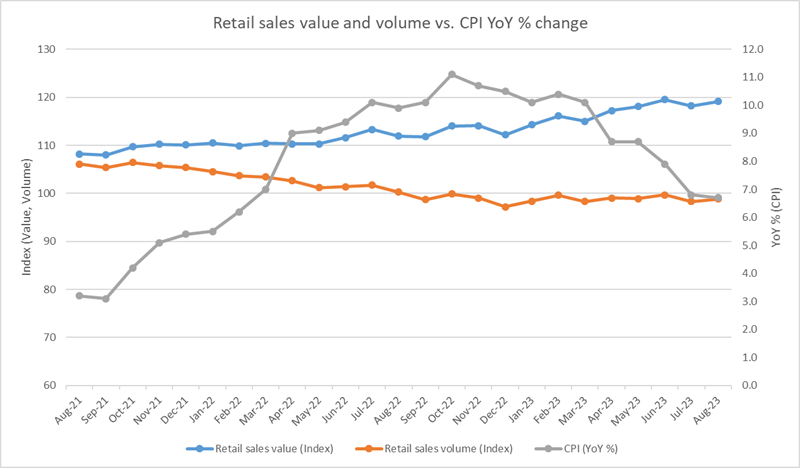
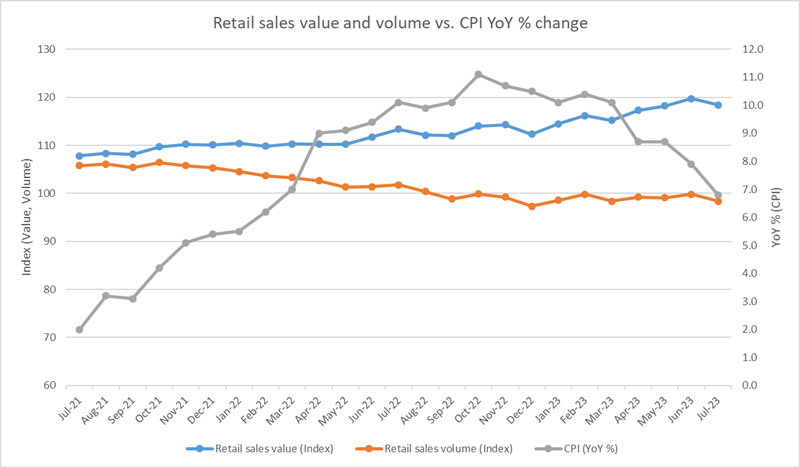
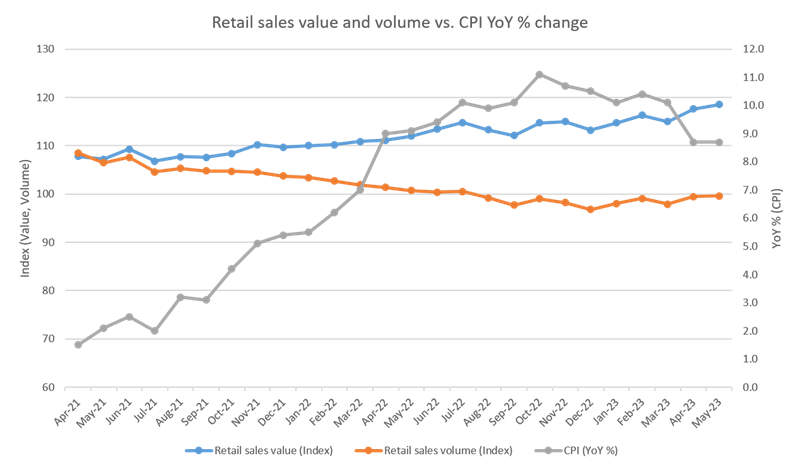
The divergence between the quantity of retail goods bought (volume) and the amount which is spent by consumers (value), has continued to deepen due to high levels of inflation which have led to marked price increases. Whilst CPI decreased in June, that has not yet lead to wider price decreases which would support the closing of this gap.
Overall, retail volume decreased by 1% in June 2023 against the previous year, whilst May 2023 showed a 1.9% decrease – this marks 15 consecutive periods of volume declines.
Retail value, on the other hand, increased 7.8% YoY in June 2023, as compared to a 0.8% increase in May 2022, and a 7.5% increase in May 2023.
Analysis and commentary prepared by Dominic Watkins and Eleanor Smith based on latest data released by the ONS.